• Blog
  • LDS
    • Canada
    • Japan
    • U.K.
    • U.S.
    • World
    • Politicians
  • Site
    • About
    • Archive
    • Best of Rickety
    • Comments Policy
    • Copyright
    • FAQ
    • Feedback
    • Guests
    • Privacy Policy
    • Technical
    • Why Blog?
  • Sundry
    • Comics
    • HyperCheese Help
    • JFHE
    • Projects
      • Book of Mormon
    • Wishful Thinking

Rickety

Mostly about Utah

  • Family
    • Jill
    • Rick
    • Children
      • Daniel
      • Jake
      • Paul
      • Sarah
      • Steven
    • Children’s Spouses
      • Adelaide
      • Derek
      • Megan
      • Rachel
      • Shelese
    • Grandchildren
      • Aurora
      • Benjamin
      • Bryson
      • Caleb
      • Calvin
      • Cassandra
      • Elizabeth
      • Ezra
      • Helen
      • Jameson
      • Ryan
      • Sadie
  • Finance
    • Bank Rewards Checking
    • Credit Union Rewards Checking
    • Debt
    • Employment
    • Money
    • Rewards Checking Posts
  • Government
    • City
    • Elections
    • Federal
    • Military
    • Paul on Politics
    • Politics
    • States
    • Taxes
  • Recreation
    • Competition
    • Food
    • Fun in Utah
    • Games
    • Music
    • Parade
    • Sports
    • Travel
  • Religion
    • Christmas
    • Family History
    • Jesus Christ
    • LDS
    • Marriage
    • Missionary
    • On Religion
    • Preparedness
    • Scriptures
    • Temple
  • Series
    • 100 Years Ago
    • Christmas Letter
    • Epic Excerpts
    • On Religion
    • Past Pictures
    • Daniel’s Mission
    • Jake’s Mission
    • Paul’s Mission
  • Technology
    • Applications
    • Blogging
    • Communication
    • Computer
    • Energy
    • Environment
    • How To
    • Photography
    • Population
    • Transportation

U.S. LDS Membership Statistics

December 22, 2011 by rickety 1 Comment

The complete updated membership statistics are available at United States LDS Membership.

Perusing the 2012 Deseret News Church AlmanacThe ranks of The Church of Jesus Christ of Latter-day Saints grew by 85,675 members in the United States during 2010. According to the 2012 Deseret News Church Almanac, the Church’s U.S. membership swelled to 6,144,582 as of January 1, 2011.

States with the largest increases were Utah (25,966), Texas (9,239), Arizona (6,715), California (5,475), and Washington (4,923).

The states with the most members are Utah (1,910,343), California (763,370), Idaho (414,182), Arizona (387,950), and Texas (296,141). The most temples, including announced or under construction, are in Utah (15), California (7), Arizona and Idaho (5), and Texas (4).

The largest LDS state populations by percentage are in Utah (68%), Idaho (27%), Wyoming (11.5%), Nevada (6.7%), and Arizona (5.8%). 20 states have Mormons representing over 1 percent of their populations and 13 states have a Mormon population of over 2 percent. States with the least Mormons are District of Columbia (0.37%), New Jersey (0.36%), and Rhode Island (0.35%).

24 states have 10 or more stakes each. The most stakes are in Utah (546), California (157), and Idaho (121) while there are no stakes in Rhode Island and District of Colombia.

2008 saw a membership decline in only one state, South Carolina. In 2009 it was Michigan’s turn to see a decline of 43 members. In 2010, Michigan with a membership loss of 237 was joined by West Virginia (-169), Delaware (-25), New Hampshire (-7), and Vermont (-2).
Rickety signature

Filed Under: LDS, Rickety Picks Tagged With: Mormon, The Church of Jesus Christ of Latter-day Saints

Past Pictures: 25 Years Of House Anniversaries

November 27, 2011 by rickety 4 Comments

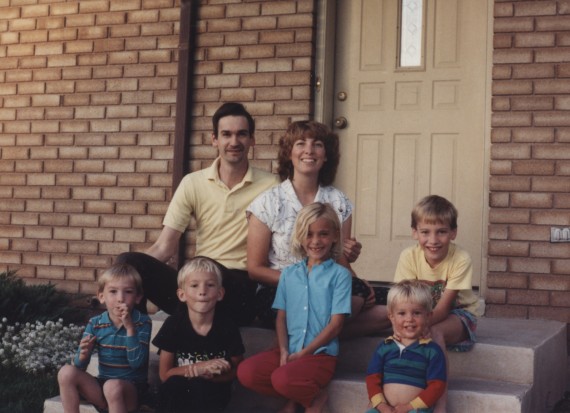
1st year anniversay

1987: 1st year house anniversary. Only four children

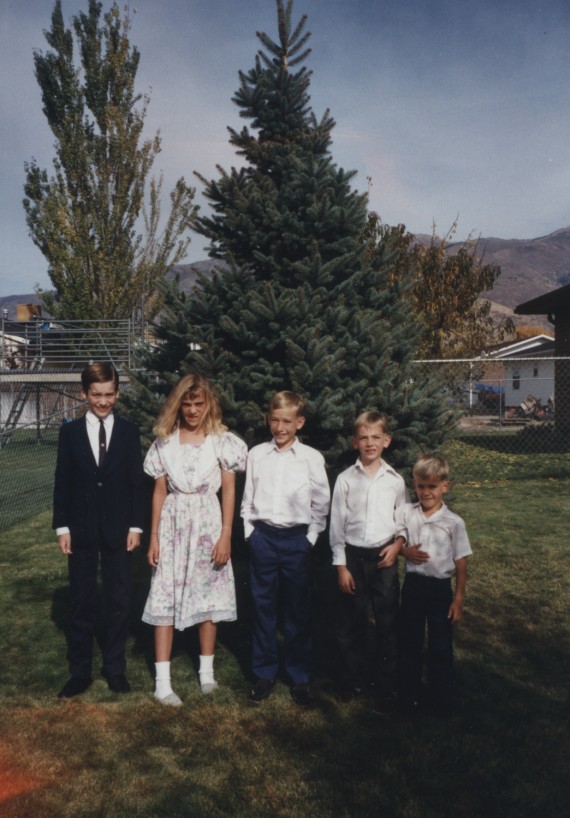
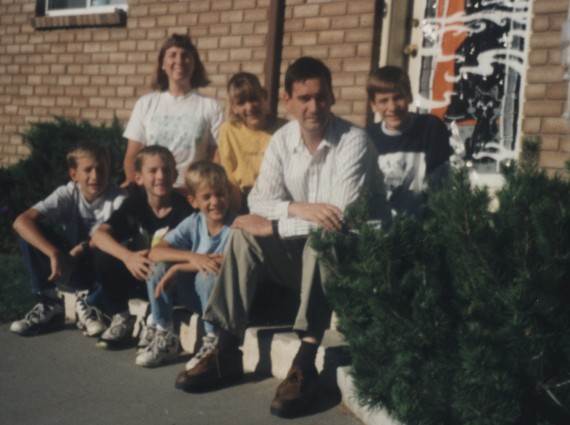
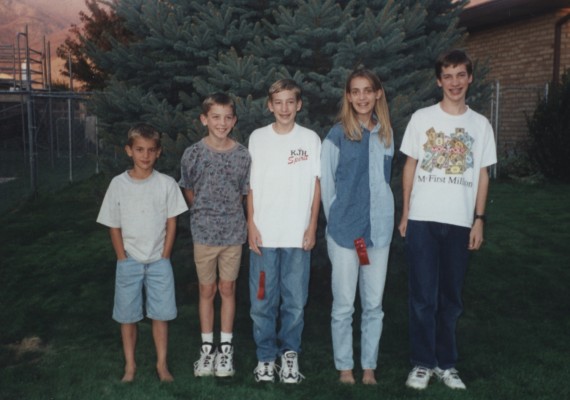
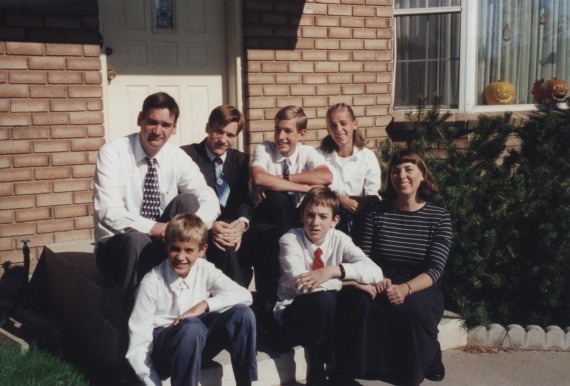
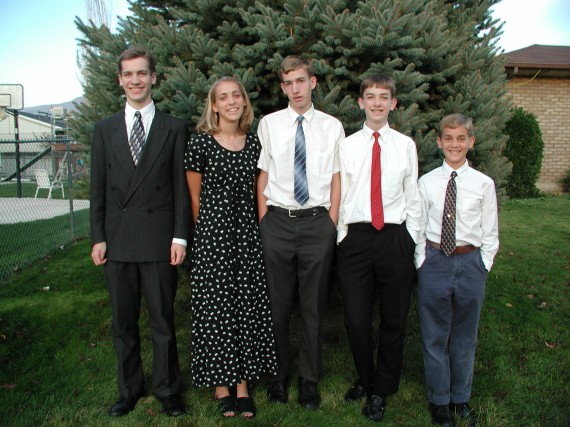
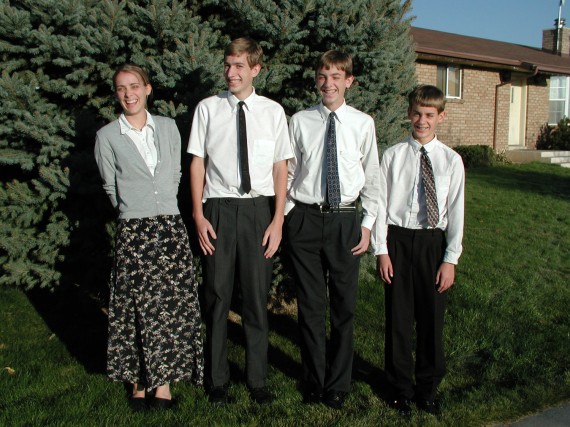
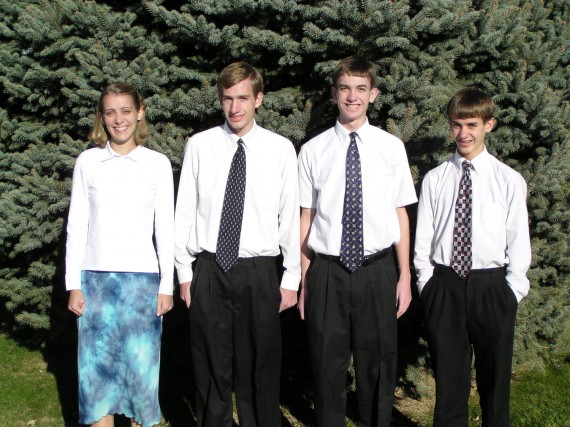
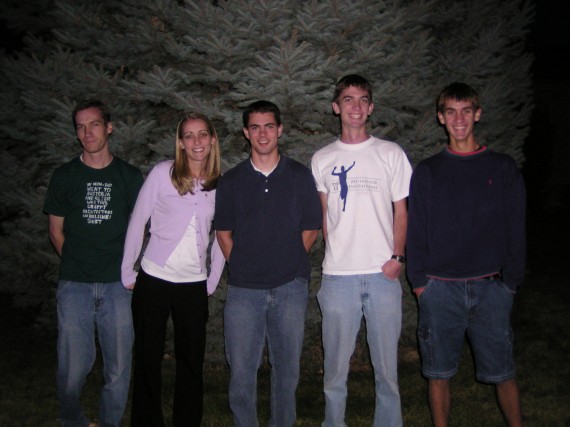
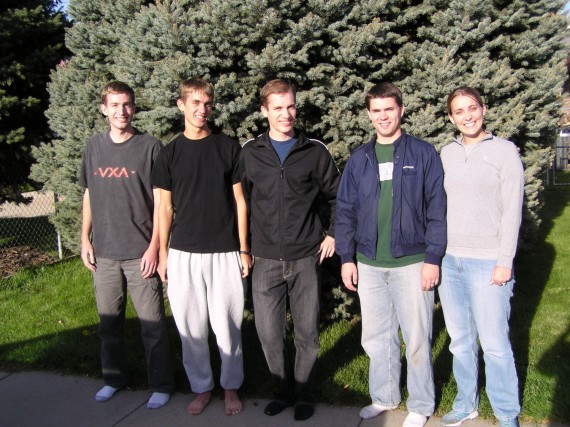
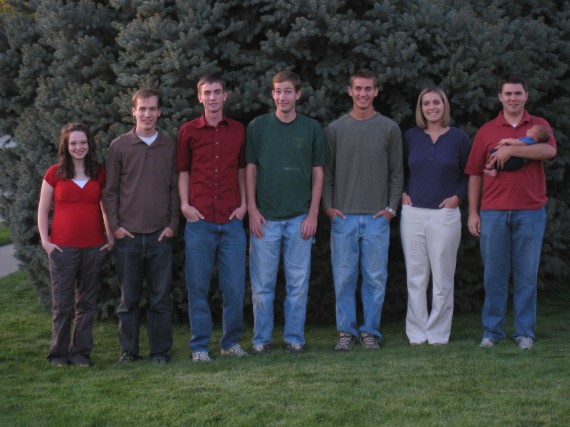
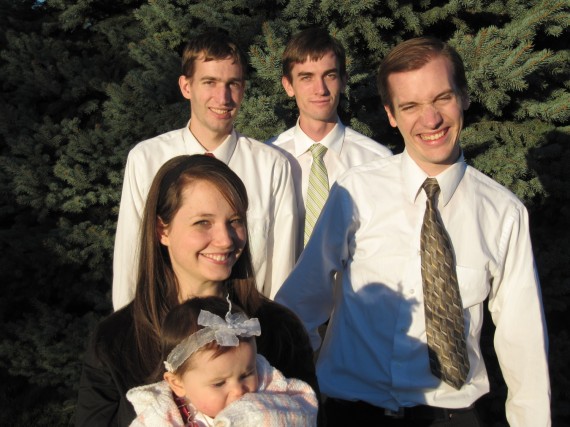
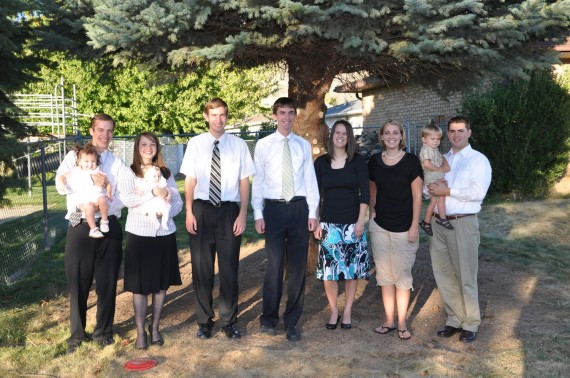
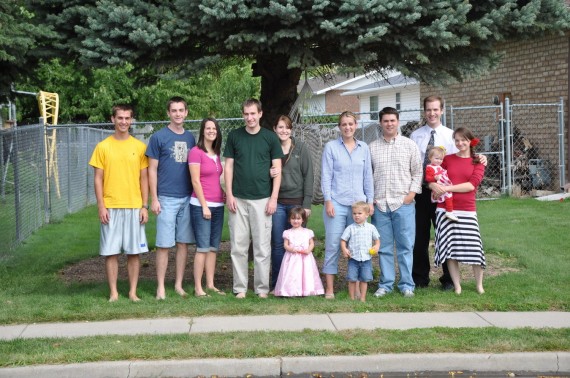
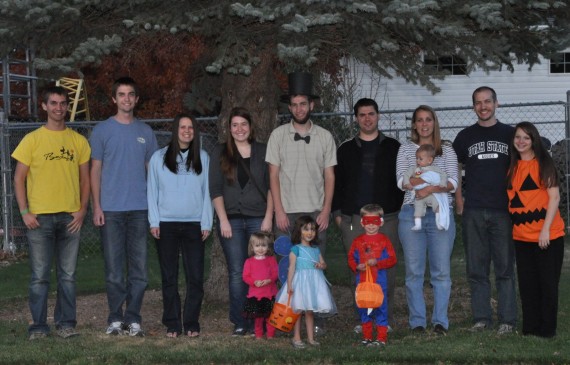
Each year in October, on the anniversary of the day we moved into our home, we take photographs of our family on the steps and just the children in front of our tree. Jill’s idea was to build up a collection of photographs to look back on.

4th year anniversary

1990: 4th year house anniversary. Daniel born in 1989

On this the 25th house anniversary year, we collected as many of the photographs as we could find and display here one for each year. Some are temporarily misplaced, so there are gaps in the record. However, we expect to find the missing years eventually.

5th year anniversary

1991: 5th year house anniversary

On the first house anniversary, Jill wrote:

We had a birthday party celebrating the day we moved into our home. Sarah brought the puzzle home from church so we put it together. Steven made the decorations. We all gave a present to the house by picking up all the garbage scattered around outside. Then we took some family pictures on the front porch. Inside we sang “Happy Birthday Dear Home” and celebrated with cake and ice cream.

6th year anniversary

1993: 7th year house anniversary. Using our tree as a backdrop

1987 Journal entry:

Monday 26th October 1987
We had a very fine FHE — the 1st birthday of our home. We even had a cake with one candle for refreshments. We took 2 photos of the family outside the house. The actual birthday is the 15th of October. Jill did the lesson — seems like Jill and I at one time were hard-pressed to come up with a lesson and didn’t like to do it. Now we both don’t like to give up our turn because we see it as a chance to teach the children something that we’re anxious for them to learn. We still have family prayers and read books to them. They like that.

9th year anniversary

1995: 9th year house anniversary. Sunday best

10th year anniversary

1996: 10th year house anniversary. Utah Centennial

11th year anniversary

1997: 11th year house anniversary

12th year anniversary

1998: 12th year house anniversary. Steven made his first million

13th year anniversary

1999: 13th year house anniversary. Cousins Connor and Ashley join in

14th year anniversary

2000: 14th year house anniversary. Five millennials for the new millenium

15th year anniversary

2001: 15th year anniversary. First year using a digital camera

16th year anniversary

2002: 16th year house anniversary. Steven is on his mission in Chile

17th year anniversary

2003: 17th year anniversary. Steven on his mission

18th year anniversary

2004: 18th year house anniversary. Steven returns. Paul on his mission in California

19th year anniversary

2005: 19th year anniversary. Paul on his mission. Derek, Sarah’s husband, center

20th year anniversary

2006: 20th year house anniversary. Paul returns. Jake on his mission in Mexico

21st year anniversary

2007: 21st year house anniversary. Jake on his mission

22nd year anniversary

2008: 22nd year house anniversary. Jake returns. Adelaide, Steven’s wife, far left. First grandchild, Bryson

23rd year anniversary

2009: 23rd year anniversary. Daniel on his mission in Mongolia. First granddaughter, Aurora. Sarah’s family in Texas

24th year anniversary

2010: 24th year house anniversary. Daniel on his mission. Second granddaughter, Cassandra. Jake engaged to Rachel. Sarah’s family returns

25th year anniversary

2011: 25th year house anniversary. Daniel returns. Paul engaged to Megan

2012: 26th year house anniversary. Second grandson, Jameson. Just prior to trick-or-treating.

Updates

Added 2012 photograph.

Rickety signature

Filed Under: Family History, Group, Jameson, Past Pictures, Rickety Picks Tagged With: Home

100 Years Ago: House Seat, Reciprocity, Liquor

October 31, 2011 by rickety Leave a Comment

New York City Prohibition

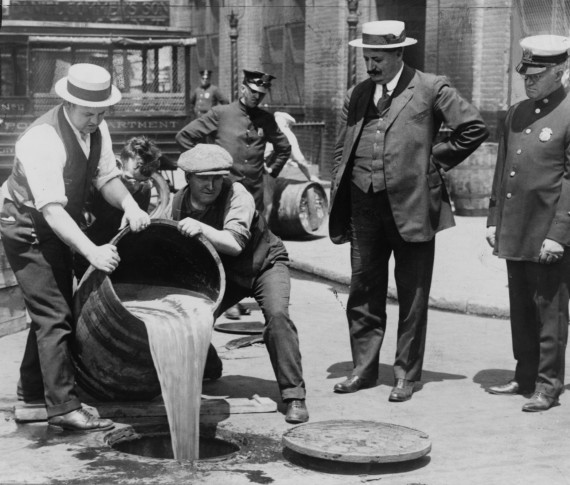
New York City Deputy Police Commissioner John A. Leach, right, watching agents pour liquor into sewer following a raid during the height of prohibition


The following was adapted from the Improvement Era magazine of October 1911.

Utah Gains House Member

Congress at the extra session passed the Congressional Reapportionment Bill, fixing the future House membership at 433 instead of the present 391. It provides for increased representation according to population, without reducing the membership from any state. This gives Utah one more member.

Before adjournment on Tuesday, 22nd August, Congress also passed the Campaign Publicity Bill, requiring the publication of all campaign contributions and expenses before elections.

A bill admitting Arizona and New Mexico was passed and signed by President Taft, so that these states will now enter the Union under certain conditions.

Among the big results of the extra session was the passing of the Canadian Reciprocity Bill.

[The number of seats in the House of Representatives is 435, and has been since 1913. Utah gained its first seat after the 1900 census, effected in 1903. The second seat was effected in 1913, after the 1910 census. After the 1980 census, Utah gained its third seat, effective in 1983. The 2010 census gave Utah its fourth congressional member.]

Canadian Reciprocity

Reciprocity suffered an overwhelming defeat in the Canadian elections held on September 21. The Liberal Party under Sir Wilfred Laurier led the fight for reciprocity, while the Conservative party, under R. L. Borden, led the opposition which won a decisive victory over the government, gaining a majority in Parliament of over fifty.

Borden will soon become the Prime Minister of Canada, and Sir Laurier will retire. The result of the election will be that the Fielding-Knox reciprocity agreement passed by the late extra session of the United States Congress will not be presented to the twelfth Canadian Parliament, which meets in October, and closer commercial relations between Canada and the United States will not be possible perhaps for years to come.

The Conservatives are committed to a closed door against the United States, and to a policy of trade-expansion within the [British] empire. President Taft was greatly disappointed at the result and believes the “annexation bogy” had much to do with the defeat of the measure in Canada.

[From 1867 to 1911, regaining reciprocity was an aim of all Canadian governments. The Conservative party, which stood publicly for nationalism and protectionism, succeeded in associating the Liberals with free trade, commercial union with the U.S., and continentalism, which smacked of absorption by the U.S.

From 1935-1980, a number of bilateral trade agreements greatly reduced tariffs in both nations.

Canada and the United States on October 4, 1988 signed The Free Trade Agreement (FTA). The agreement removed several trade restrictions in stages over a ten year period. With the addition of Mexico in 1994 FTA was superseded by the North American Free Trade Agreement (NAFTA).]
The Liquor Question

The local election held in Bannock county on Wednesday, September 6th resulted in a victory for prohibition, and the county went dry by a majority of over 700.

The vote of a few of the leading towns are as follows: Pocatello, wet by a majority of 568; Soda Springs, dry 129, wet 116; Grace, dry 209, wet 44; Bancroft, dry 242, wet 44; Thatcher dry 176, wet 18.

[Idahoans approved state-wide prohibition in 1916. They ratified National Prohibition in January 8, 1919. It was widely believed that prohibiting alcohol would reduce crime, improve health, raise morality, and protect young people.

There was a strong demand for alcohol, and illegal operators quickly moved in to supply that demand. In order to operate, illegal alcohol producers and distributors routinely bribed law enforcement officers and others. Sometimes law enforcement officers themselves were directly involved in moonshining and bootlegging.

Those who couldn’t be bought off were sometimes threatened and intimidated. The frequent revelations of corruption turned many against Prohibition and lowered respect for law. Residents became increasingly concerned over problems created by Prohibition.

On October 17, 1933, by a vote of nearly 60%, Idaho called for the repeal of National Prohibition. Source: National Prohibition and Repeal in Idaho.]

Adapted from: “Passing Events”, Improvement Era, Vol. XIV. October, 1911. No. 12.

Photo Credit: Library of Congress
Rickety signature

Filed Under: 100 Years Ago, Rickety Picks Tagged With: Canada, Congress, Prohibition, Utah

Horses Are Food

October 30, 2011 by Daniel 5 Comments

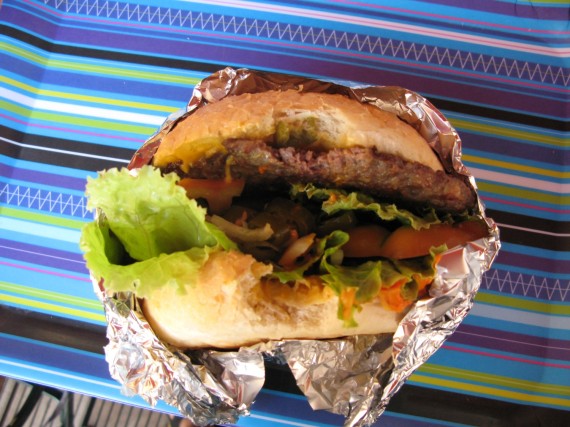
Slovenian Horse Meat Burger

Slovenian Horse Meat Burger


My guest writer is my son Daniel, who ate horse meat in Mongolia as illustrated in this comic strip.

Cows, chickens, turkeys, and pigs have been slaughtered for years to feed people in the United States. Horse meat, however, is controversial and disputed on whether or not it is classified as food.

One use of horses is defined by using them for transportation and working on farms. Modern technology, such as cars and tractors, have greatly decreased the amount of time it takes to do tasks previously done by horses. Today, horses are no longer useful for transportation or to do farm work because they cannot compete with modern technology.

Another category for horses is using them for recreation. Horse back riding and horse races are enjoyed by many people. Although horses can be fun, this does not make up for the thousands of pounds of horse meat that goes to waste because of the restrictions forbidding ranchers to sell horse meat, including the meat of old and dying horses.

Horses need to be classified as a source of food so that their meat can be tasted instead of wasted. There are many countries around the world that eat horse meat every day. Mongolia raises a majority of its horses specifically to be eaten. Currently in America, disposing of dying horses is very expensive but it does not have to be.

A better way to dispose of aging horses is eating them. Once Americans adjust to the idea of eating horse meat, they may develop a taste for it. A dead horse would become a source of income for owners rather than having to pay a fee to ship them away. Horses, like other farm animals, should be eaten, as they too can be a good source of food.

Photo Credit: pak shilla
Rickety signature

Filed Under: Food, Rickety Picks Tagged With: Horse

Ford Canyon

July 17, 2011 by rickety 4 Comments

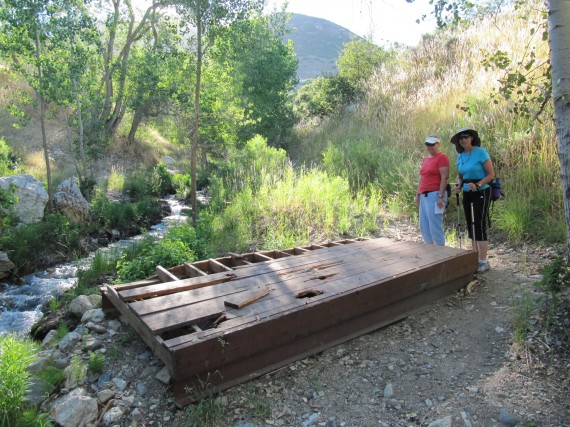
Ford Canyon bridge

Susan and Jill check out the destroyed bridge

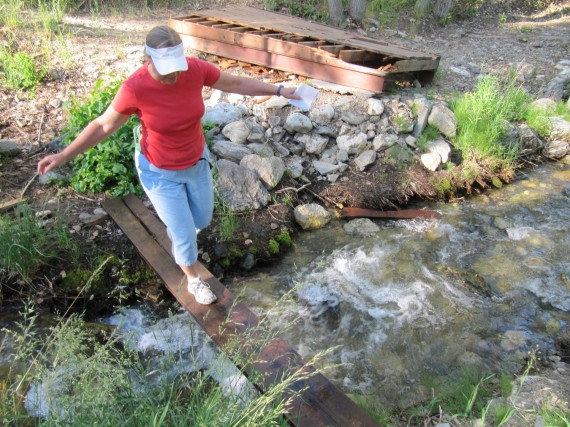
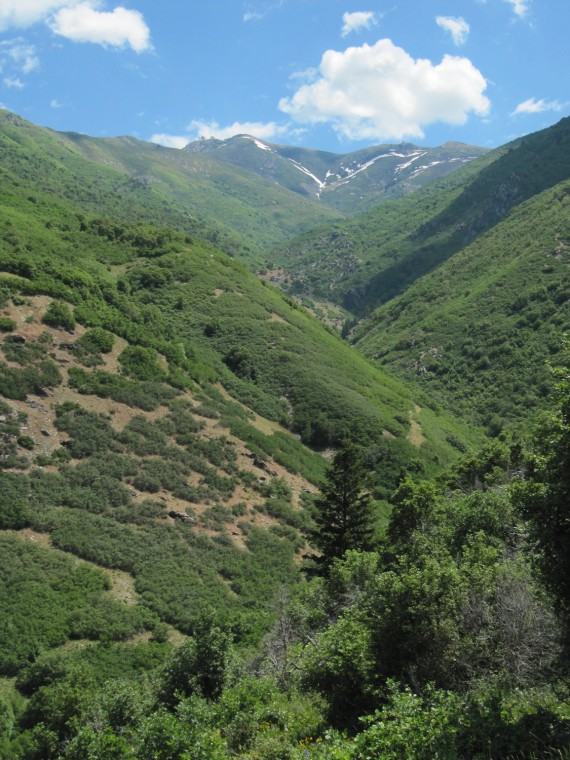
Last Saturday I ventured up Ford Canyon with Jill and Susan. The bridges were washed out so I fished a plank out of the water and we used that to cross Ricks Creek. We were not very far from civilization but it seemed like it as we got stuck in the undergrowth. We followed a trail upward but when it ended we had to descend to the creek again. Jill and Susan checked out the north side of the canyon but could go no further.

Ford Canyon Susan crossing Ricks creek

Susan crossing Ricks creek

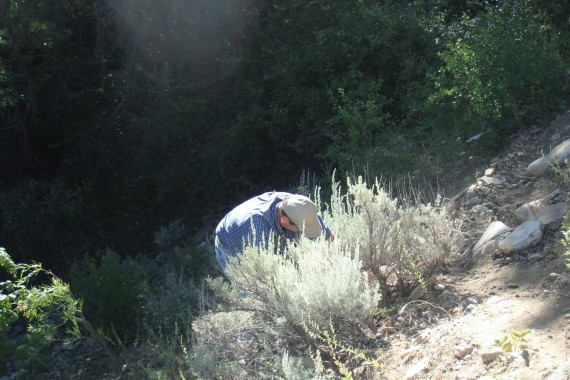
I investigated the south side but could find no trail through. Jill and Susan returned to where I was climbing back up from the creek. We gave up and went back to our car and drove to Firebreak Road.

Ford Canyon Rick climbing up

Rick climbing back up to the trail. Photo by Susan Ward

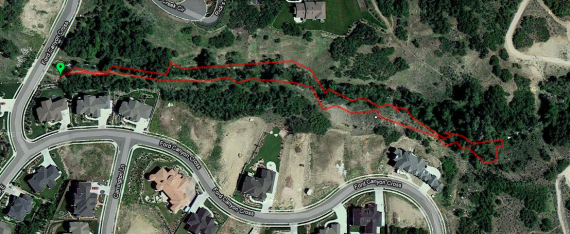
I tracked this aborted attempt to find the trail in Ford Canyon using Google My Tracks (shut down 1 May 2016 by Google). My Tracks is was an application for your Android phone that enabled you to record GPS tracks and view live statistics such as time, speed, distance, and elevation while hiking.

Ford Canyon

Ford Canyon trail recorded using Google My Tracks

Here are some of the metrics that My Tracks recorded:

Total Distance: 1.15 km (0.7 mi)
Total Time: 44:13
Moving Time: 15:03
Average Speed: 1.56 km/h (1.0 mi/h)
Average Moving Speed: 4.59 km/h (2.9 mi/h)
Max Speed: 8.49 km/h (5.3 mi/h)
Min Elevation: 1324 m (4344 ft)
Max Elevation: 1380 m (4529 ft)
Elevation Gain: 88 m (287 ft)

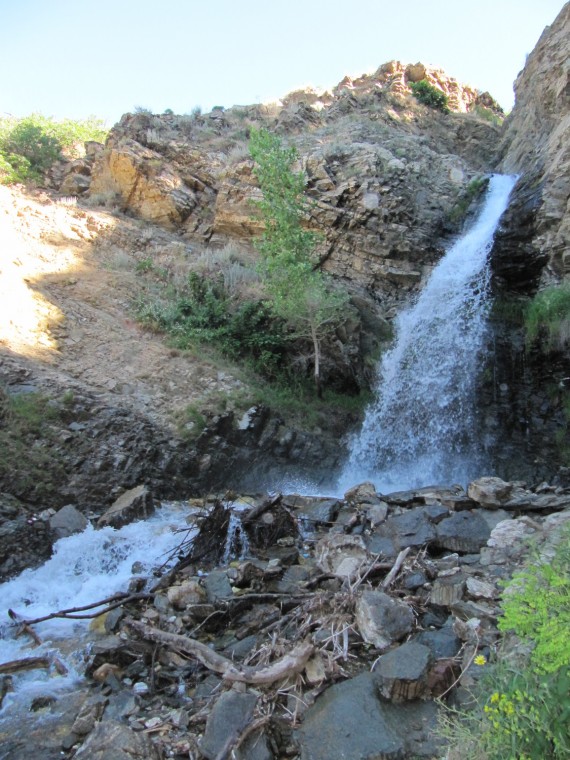
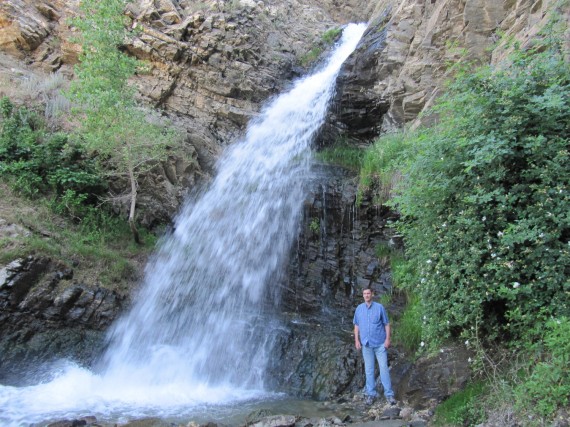
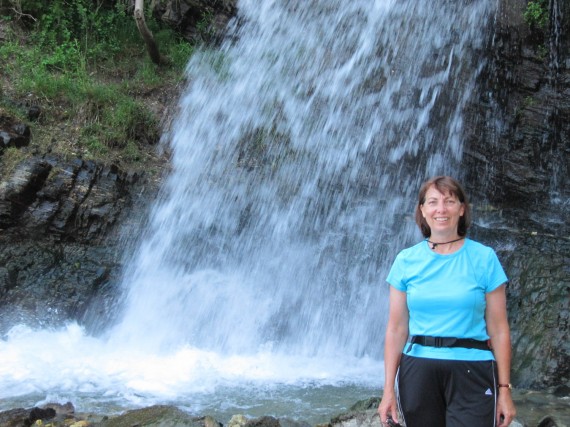
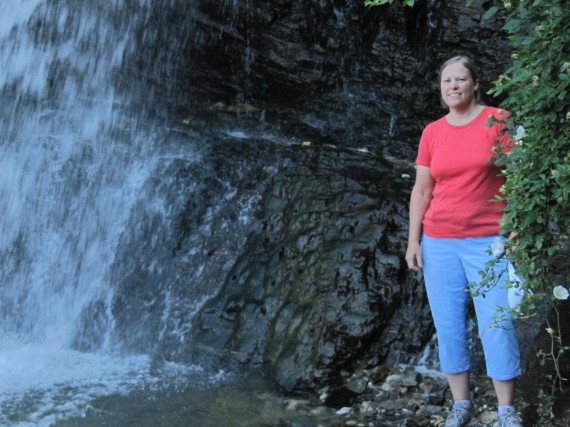
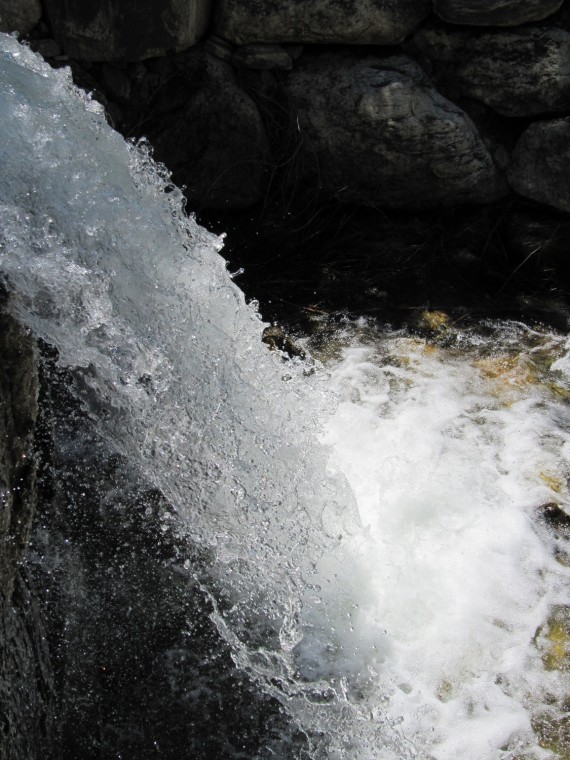
From Firebreak Road there was a short trail that took us to Ford Canyon waterfall. Once we got to the waterfall we all had to pose by it, like it was the eighth wonder of the world. I even took a video of the waterfall, it is at the end of the post.

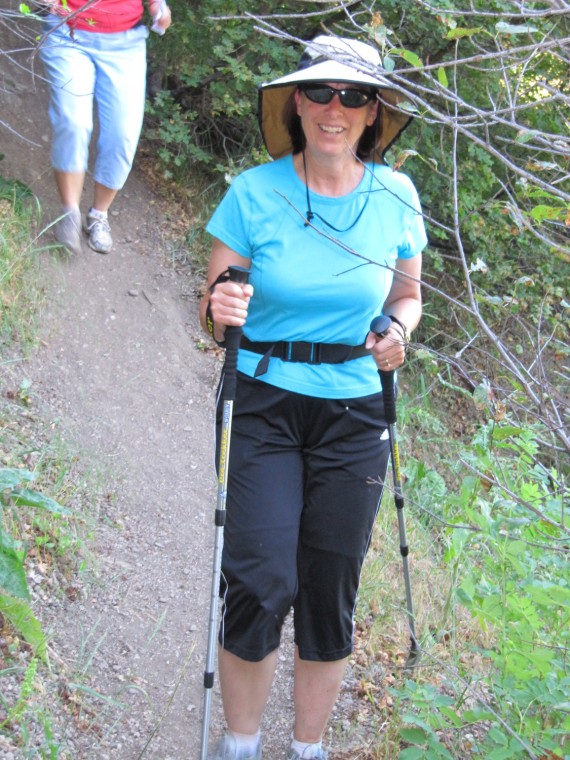
Ford Canyon Jill on the trail

Jill on the trail to the waterfall

Ford Canyon waterfall

First view of the waterfall

Ford Canyon Rick by waterfall

Rick by the waterfall

Ford Canyon Jill by waterfall

Jill by the waterfall

Ford Canyon Susan by waterfall

Susan by the waterfall

Poster Image


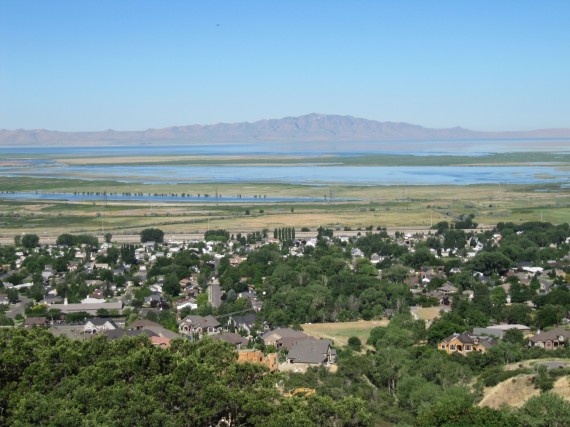
Ford Canyon view

Antelope Island from Firebreak Road


Rickety signature

Filed Under: Fun in Utah, Jill, Recreation, Rick, Rickety Picks Tagged With: Centerville, Susan, Utah

Real Population Density

July 4, 2011 by rickety 2 Comments

Boise Valley wheat field

Boise Valley, Idaho wheat field around 1920

In the United States, in these times of high unemployment, increasing deficits, and seemingly endless wars, it would be well to count our blessings. One such blessing is the bounteous land in which we live. The United States has more arable land than any other country. Even though the United States is the third most populous nation on Earth, her Real Population Density ranks as twelfth least dense of all nations.

As the world’s population increases and ever more demands are placed on the food supply, am I thankful to be living in the United States. Let me explain some of the terms associated with real population density and show you the favorable numbers for the U.S.A.

Arable Land

Agricultural area includes land suitable for crops and livestock. The standard classification, used by Food and Agriculture Organization of the United Nations, divides agricultural area into these components:

  • Arable Land — land under annual crops, such as cereals, potatoes, vegetables, and melons that are replanted after each harvest; also land left temporarily fallow.
  • Orchards and Vineyards — land under permanent crops such as citrus, coffee, and rubber that are not replanted after each harvest.
  • Meadows and Pastures — areas for natural grasses and grazing of livestock.

In 2008, the world’s total arable land amounted to 13,805,153 square kilometers, whereas 48,836,976 square kilometers was classified as agricultural land. In this post, we are focused on arable land. Of interest is this map of the world with arable land percentages showing the United States in the 15-19% range.

Real Population Density

Population density is the number of people per square kilometer. Real Population Density is the number of people per square kilometer of arable land. This enables us to see the capacity of a country to feed their own people.

Real Population Density is a much better measure than pure population density as it shows how a seemingly more densely populated country can carry a larger population because a much bigger portion of the land is suitable for agriculture.

For those of us used to thinking in acres, one square kilometer is equal to 247.1 acres.

Table of Countries by Real Population Density

Click ONCE on column headers to sort.

Rank  Country1 Real Density2 Population  Arable Land (km2)
1 Australia 48 22,268,000 468,503
2 Kazakhstan 72 16,026,000 221,059
3 Canada 82 34,017,000 415,573
4 Niger 107 15,512,000 144,784
5 Lithuania 114 3,324,000 29,216
6 Russia 117 142,958,000 1,218,599
7 Latvia 126 2,252,000 17,926
8 Ukraine 140 45,448,000 324,791
9 Argentina 147 40,412,000 274,490
10 Guyana 172 754,000 4,390
11 Belarus 173 9,595,000 55,575
12 United States 188 310,384,000 1,650,062
13 Moldova 196 3,573,000 18,194
14 Paraguay 218 6,455,000 29,678
15 Hungary 218 9,984,000 45,782
16 Bulgaria 226 7,494,000 33,099
17 Central African Republic 228 4,401,000 19,313
18 Turkmenistan 229 5,042,000 22,013
19 Mongolia 232 2,756,000 11,887
20 Romania 236 21,486,000 90,961
21 Denmark 249 5,550,000 22,295
22 Uruguay 250 3,369,000 13,490
23 Togo 251 6,028,000 24,038
24 Zambia 253 13,089,000 51,777
25 Estonia 258 1,341,000 5,207
26 Finland 269 5,365,000 19,913
27 Sudan 270 43,552,000 161,093
28 Namibia 279 2,283,000 8,172
29 New Zealand 294 4,368,000 14,848
30 Samoa 295 183,000 620
31 Serbia 299 9,856,000 32,990
32 Croatia 302 4,403,000 14,566
33 Poland 312 38,277,000 122,547
34 Turkey 317 72,752,000 229,764
35 Chad 318 11,227,000 35,258
36 Nicaragua 325 5,788,000 17,810
37 Bolivia 329 9,930,000 30,146
38 Brazil 333 194,946,000 586,036
39 Cameroon 333 19,599,000 58,868
40 Mali 335 15,370,000 45,872
41 Spain 339 46,077,000 135,776
42 South Africa 340 50,133,000 147,609
43 Benin 340 8,850,000 26,029
44 Burkina Faso 341 16,469,000 48,353
45 France 344 62,787,000 182,568
46 Czech Republic 350 10,493,000 29,999
47 Libya 351 6,355,000 18,123
48 Montenegro 363 631,000 1,740
49 Cuba 368 11,258,000 30,631
50 Bosnia and Herzegovina 375 3,760,000 10,026
51 Macedonia 377 2,061,000 5,471
52 Morocco 377 31,951,000 84,797
53 Slovakia 383 5,462,000 14,264
54 Sweden 385 9,380,000 24,368
55 Ireland 386 4,470,000 11,587
56 Cambodia 392 14,138,000 36,081
57 Zimbabwe 395 12,571,000 31,862
58 Tunisia 396 10,481,000 26,489
59 Afghanistan 400 31,412,000 78,542
60 Greece 425 11,359,000 26,749
61 Kyrgyzstan 426 5,334,000 12,530
62 Fiji 430 861,000 2,001
63 Syrian Arab Republic 447 20,411,000 45,644
64 Belize 448 312,000 696
65 Iran 462 73,974,000 160,001
66 Mexico 466 113,423,000 243,457
67 Algeria 470 35,468,000 75,501
68 Gabon 483 1,505,000 3,118
69 Myanmar 489 47,963,000 98,135
70 Thailand 490 69,122,000 140,941
71 Azerbaijan 518 9,188,000 17,754
72 Senegal 518 12,434,000 24,019
73 Nigeria 527 158,423,000 300,736
74 Botswana 527 2,007,000 3,805
75 Equatorial Guinea 539 700,000 1,299
76 Georgia 543 4,352,000 8,022
77 Mozambique 549 23,391,000 42,576
78 Iraq 559 31,672,000 56,700
79 Angola 578 19,082,000 33,038
80 Albania 582 3,204,000 5,507
81 Norway 587 4,883,000 8,312
82 Ghana 602 24,392,000 40,507
83 Côte d’Ivoire 607 19,738,000 32,531
84 Austria 614 8,394,000 13,677
85 Uzbekistan 614 27,445,000 44,710
86 Gambia 620 1,728,000 2,788
87 Panama 637 3,517,000 5,517
88 Armenia 649 3,092,000 4,766
89 Guinea-Bissau 651 1,515,000 2,327
90 Lesotho 658 2,171,000 3,300
91 Laos 670 6,201,000 9,255
92 Portugal 672 10,676,000 15,898
93 Bhutan 672 726,000 1,081
94 Swaziland 673 1,186,000 1,763
95 Madagascar 708 20,714,000 29,251
96 Germany 711 82,302,000 115,698
97 Honduras 713 7,601,000 10,663
98 Tonga 722 104,000 144
99 Tajikistan 739 6,879,000 9,304
100 Ethiopia 740 82,950,000 112,080
101 Malawi 766 14,901,000 19,456
102 Uganda 776 33,425,000 43,077
103 Italy 780 60,551,000 77,651
104 Peru 789 29,077,000 36,864
105 Republic of the Congo 816 4,043,000 4,952
106 Luxembourg 819 507,000 619
107 Saudi Arabia 838 27,448,000 32,742
108 India 844 1,224,614,000 1,451,809
109 Chile 872 17,114,000 19,619
110 Kenya 889 40,513,000 45,597
111 North Korea 903 24,346,000 26,972
112 Suriname 904 525,000 581
113 Eritrea 906 5,254,000 5,799
114 Somalia 907 9,331,000 10,288
115 Guinea 908 9,982,000 10,990
116 Pakistan 912 173,593,000 190,319
117 Dominican Republic 912 9,927,000 10,881
118 Timor-Leste 913 1,124,000 1,231
119 Ecuador 915 14,465,000 15,808
120 Burundi 919 8,383,000 9,124
121 Rwanda 935 10,624,000 11,366
122 Comoros 945 735,000 778
123 El Salvador 953 6,193,000 6,500
124 China 968 1,341,335,000 1,385,905
125 Guatemala 1,004 14,389,000 14,334
126 Dem Rep of Congo 1,017 65,966,000 64,853
127 Sierra Leone 1,031 5,868,000 5,694
128 Cape Verde 1,078 496,000 460
129 Cyprus 1,105 1,104,000 999
130 United Kingdom 1,105 62,036,000 56,121
131 Venezuela 1,153 28,980,000 25,138
132 Slovenia 1,181 2,030,000 1,719
133 Indonesia 1,191 239,871,000 201,456
134 Tanzania 1,196 44,841,000 37,479
135 Vanuatu 1,200 240,000 200
136 Liberia 1,209 3,994,000 3,304
137 Haiti 1,290 9,993,000 7,747
138 Belgium 1,290 10,712,000 8,302
139 Mauritius 1,306 1,299,000 995
140 Viet Nam 1,341 87,848,000 65,528
141 Nepal 1,363 29,959,000 21,984
142 Saint Vincent 1,557 109,000 70
143 Yemen 1,566 24,053,000 15,364
144 Malaysia 1,583 28,401,000 17,939
145 Jamaica 1,598 2,741,000 1,715
146 Philippines 1,646 93,261,000 56,652
147 Mauritania 1,679 3,460,000 2,061
148 Barbados 1,706 273,000 160
149 Trinidad and Tobago 1,788 1,341,000 750
150 Switzerland 1,945 7,664,000 3,941
151 Sao Tome and Principe 1,988 165,000 83
152 French Guiana 1,991 231,000 116
153 Bangladesh 2,005 148,692,000 74,173
154 Jordan 2,027 6,187,000 3,053
155 Costa Rica 2,090 4,659,000 2,229
156 Netherlands Antilles 2,094 201,000 96
157 Colombia 2,217 46,295,000 20,878
158 Netherlands 2,233 16,613,000 7,441
159 Guadeloupe 2,305 461,000 200
160 Sri Lanka 2,308 20,860,000 9,038
161 Israel 2,362 7,418,000 3,141
162 Réunion 2,424 846,000 349
163 Lebanon 2,527 4,228,000 1,673
164 Micronesia 2,775 111,000 40
165 Egypt 2,791 81,121,000 29,067
166 Japan 2,901 126,536,000 43,620
167 South Korea 2,960 48,184,000 16,280
168 Taiwan 2,979 23,061,689 7,742
169 Papua New Guinea 3,091 6,858,000 2,219
170 Solomon Islands 3,146 538,000 171
171 Brunei Darussalam 3,627 399,000 110
172 Palestinian Territory 3,821 4,039,000 1,057
173 Malta 4,212 417,000 99
174 Martinique 4,229 406,000 96
175 New Caledonia 4,254 251,000 59
176 Saint Lucia 4,462 174,000 39
177 Iceland 4,571 320,000 70
178 Grenada 5,200 104,000 20
179 Aruba 5,350 107,000 20
180 Virgin Islands 5,450 109,000 20
181 Bahamas 5,914 343,000 58
182 Maldives 7,900 316,000 40
183 Guam 9,000 180,000 20
184 Qatar 9,356 1,759,000 188
185 Western Sahara 10,019 531,000 53
186 French Polynesia 10,037 271,000 27
187 Oman 10,910 2,782,000 255
188 Puerto Rico 11,465 3,749,000 327
189 United Arab Emirates 11,774 7,512,000 638
190 Kuwait 18,247 2,737,000 150
191 Bahrain 66,421 1,262,000 19
192 Djibouti 98,778 889,000 9
193 Hong Kong 133,075 7,053,000 53
194 Singapore 508,600 5,086,000 10
195 Macao3 — 544,000 0


Notes

  1. Countries and territories of less than 100,000 in 2009 are not included.
  2. Real Density is population per square kilometer of arable land.
  3. Macao has no arable land, hence real population density is not calculated.

Sources

  • Population: United Nations, Department of Economic and Social Affairs, Population Division (2011): World Population Prospects: The 2010 Revision. New York, accessed July 4th, 2011.
  • Taiwan Population: Wikipedia, accessed July 4th, 2011. Taiwan is not recognized by the United Nations.
  • Arable Land: The World Factbook.
  • Photo Credit: Water Archives.

External Articles

This list is updated occasionally, with newer additions listed first.

  • How poverty has tracked global population — There’s nothing Malthusian going on here.

Rickety signature

Filed Under: Food, Population, Rickety Picks

Shepard Creek Trail

July 2, 2011 by rickety 3 Comments

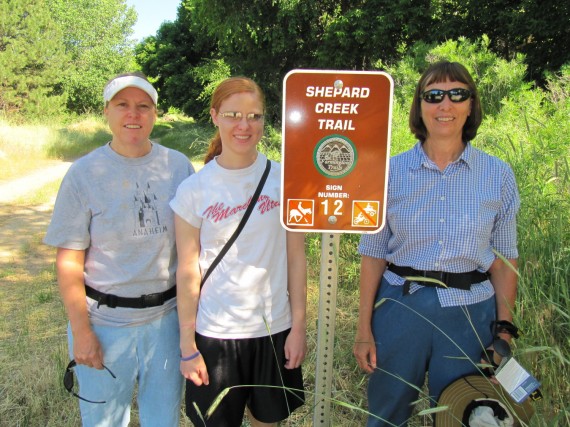
Shepard Creek Trail - Susan,  Shauna, and Jill

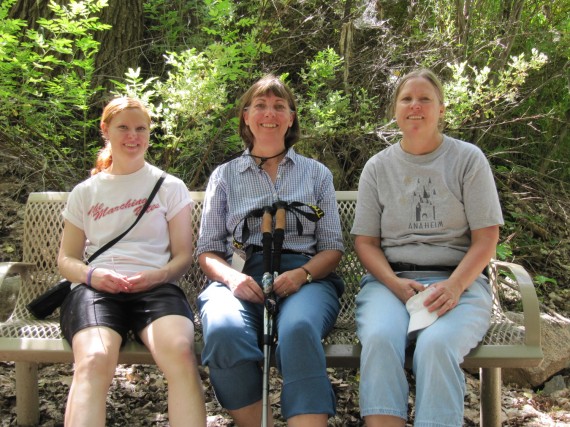
Shepard Creek Trail - Susan, Shauna, and Jill

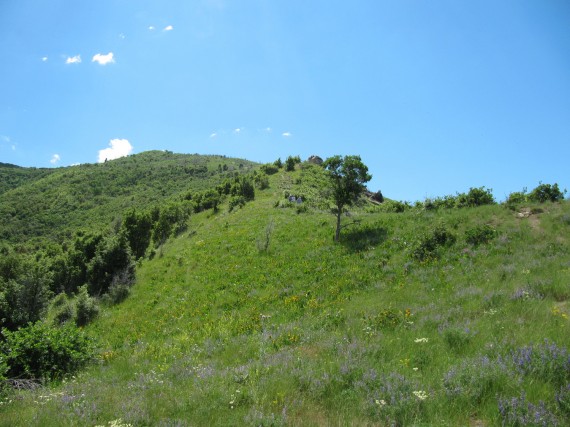
Yesterday Susan, Shauna, Jill and I hiked Shepard Creek Trail. Shepard Creek Trail winds out of several residential areas in Somerset and Shepard Heights and up a canyon. To get to the trail, from Main Street go east toward the mountains on 1400 North one block. Look for a dirt road to the north and park along 1400 North. Step over the pedestrian gate.

Shepard Creek Trail stream

Shepard Creek

Walk north up the dirt road. This is part of the old Bamberger Railroad right of way. As you come to a large open area, cross near a stone culvert, past the weather station, to the far side of Shepard Creek. The trail parallels the creek winding through trees and crossing two bridges. The first bridge is a large log with a rope as a handrail. Turn left and follow the trail beside the stream.

Shepard Creek Trail steep in places

The trail was steep in places

When you come to some wooden steps, go straight across and continue paralleling the stream until you reach another set of wooden steps. Turn left and cross the second bridge. Follow the trail again paralleling the stream. You will pass some houses. If you take a wrong turn you could end up in someone’s kitchen. So watch for the trail markers.

Shepard Creek Trail flowers

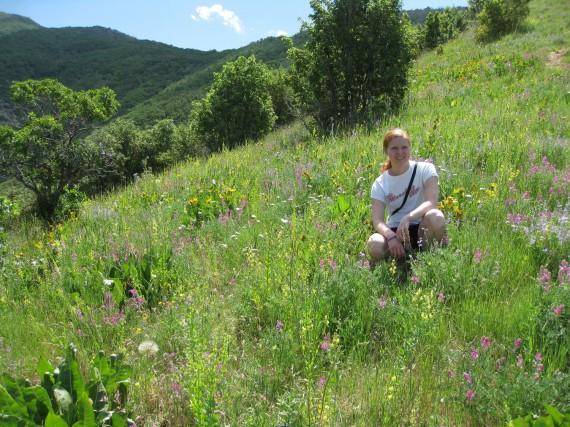
Flowers along the trail

Keep bearing to the right and eventually you will rise up a short hill to an intersection where there is a bench. The Somerset section of the trail continues on from here.

In 10 or 20 minutes, the trail will come out on Bella Vista Drive. Look up the canyon over your right shoulder to see the break in the chain link fence where the trail continues.

Hike up the dirt road about 200 feet and watch for the trail to cut up the slope to the right. Continue up the trail beyond the chain link fence and hike straight up the dirt road until it “T’s”.

Go left at the “T” and follow this dirt road. After 75 to 100 feet, keep an eye to the right of the road for a faint footpath. Follow the footpath up a ways where it turns to the south. Notice that there is a footpath that travels east up and over a rock outcropping. Another trail goes south from here to Farmington Canyon.

It was a hot day but most of the first part of the trail was shaded. Once out in the open one could feel the sun. Occasionally there was a gentle breeze which felt really good.

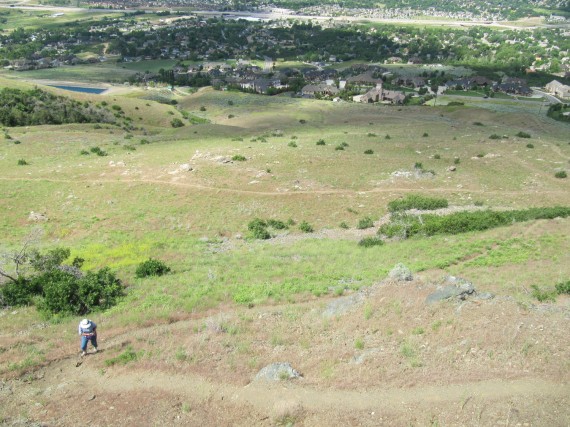
We didn’t get to the end of the trail. A hiker on his return trip said it was very steep further up the trail. We weren’t equipped with hiking boots so we eventually turned back after admiring the view.

Shepard Creek Trail bench

There were several benches along the trail

Shepard Creek Trail uphill

Further up the trail

Shepard Creek Trail - Jill

Jill on the trail

Shepard Creek Trail - Shauna

Shauna with a view of the valley behin her

Shepard Creek Trail view of LDS granary

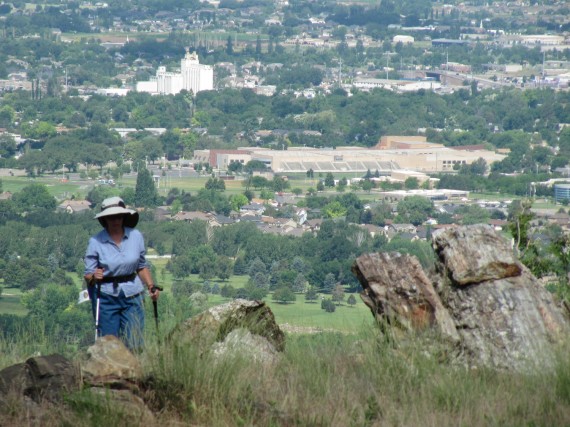
Jill with the Kaysville LDS granary in the distance

Shepard Creek Trail sego lily

Utah's state flower, the sego lily, by the side of the trail

Shepard Creek Trail flowers Shauna

Shauna and flowers

FAA long-range radar site atop Francis Peak

Shepard Creek Trail return trip

Jill, Shauna, and Susan make the return trip

Shepard Creek Trail waterfall

On our return, this little waterfall cooled the air while we rested

Rickety signature

Filed Under: Fun in Utah, Jill, Recreation, Rick, Rickety Picks Tagged With: Hike, Shauna, Susan

2010 Defense Spending by Country

June 4, 2011 by rickety 24 Comments

2010 Defense Spending by Country

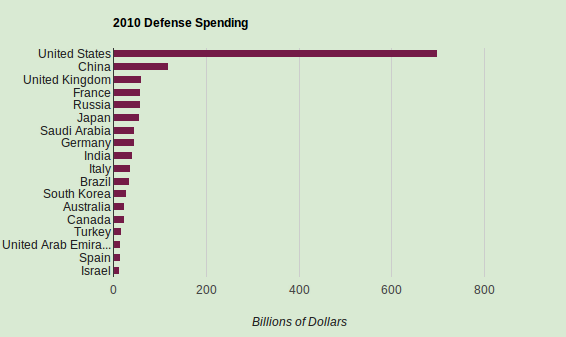
The eighteen countries with the largest military budgets. See table below for actual dollar amounts.

Military Expenditures

The eighteen nations with the largest military budgets in 2010 are shown in the chart above (click to enlarge). The United States, with a budget of $698 billion, spends more on defense than the next seventeen nations combined. The United States military spending is almost six times that of the next biggest spender, China ($119 billion) and more than eleven times that of Russia ($59 billion).

The Department of Defense budget in fiscal year 2010 accounted for 19% of the United States federal budget and 28% of estimated tax revenues. The U.S. accounts for 40% of the world’s yearly defense outlays.

Defense Spending by GDP – Top Ten Countries

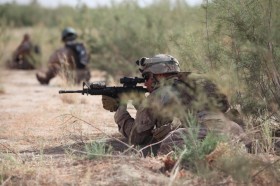
Patrol near Combat Outpost Castle, Helmand province, Afghanistan

U.S. Marine patrol, Combat Outpost Castle, Afghanistan

  1. Eritrea 20.9%
  2. Saudi Arabia 11.2%
  3. Oman 9.7%
  4. United Arab Emirates 7.3%
  5. Timor Leste 6.8%
  6. Israel 6.3%
  7. Chad 6.2%
  8. Jordan 6.1%
  9. Georgia 5.6%
  10. Iraq 5.4 %

When spending is considered by percent of gross domestic product (GDP), the United States is not even in the top ten. At 4.7% of GDP the U.S. falls to eleventh place.

Six of the ten countries listed are in the Middle East where there are sharp regional tensions. The fear of conventional military attack is very real which helps justify high defense spending.

Internal instability is a growing factor and is a threat to the existing power structure within states, as demonstrated by recent uprisings in Tunisia, Egypt, Libya, and other Middle East countries.

GDP percentages are for 2009, except for Eritrea (2003). The list contains seven countries that do not appear in the table below because their total military spending is lower than the top thirty nations.

Table Of Defense Spending – Top 30 Countries in 2010

Click ONCE on column headers to sort.

Country $billion1 $ Rank %GDP2 %GDP Rank3 $ Per Capita
United States4 & 8 698.3 1 4.7 11 2,260
China9 119.4 2 2.2 55 88
United Kingdom 59.6 3 2.7 45 963
France 59.3 4 2.5 47 915
Russia 58.7 5 4.3 14 419
Japan7 54.5 6 1.0 129 429
Saudi Arabia5 45.2 7 11.2 2 1,727
Germany 45.2 8 1.4 99 550
India 41.3 9 2.8 42 34
Italy11 37.0 10 1.8 77 615
Brazil 33.5 11 1.6 88 172
South Korea10 27.6 12 2.9 39 569
Australia 24.0 13 1.9 70 1,115
Canada 22.8 14 1.5 91 672
Turkey 17.5 15 2.7 44 231
United Arab Emirates12 16.1 16 7.3 4 3,410
Spain 15.4 17 1.1 122 339
Israel6 14.0 18 6.3 6 1,929
Netherlands 11.2 19 1.5 93 671
Colombia 10.7 20 3.7 25 232
Greece 9.4 21 3.2 34 835
Taiwan 9.1 22 2.4 49 395
Poland 8.9 23 1.8 78 234
Singapore 8.4 24 4.3 13 1,736
Indonesia 7.2 25 0.9 136 31
Chile5 6.9 26 3.5 28 404
Norway 6.7 27 1.6 87 1,385
Algeria 5.7 28 3.8 21 160
Pakistan 5.6 29 2.8 43 31
Sweden 5.6 30 1.2 118 607


Notes

  1. Figures are in US $billions at 2010 prices and exchange rates.
  2. Percent GDP is for 2009.
  3. Percent GDP ranking is included because high expenditure countries are not necessarily spending at high percent of GDP.
  4. $159.3 billion of the U.S. budget is for “Overseas Contingency Operations,” to fight the wars in Afghanistan and Iraq.
  5. Figures for Chile and Saudi Arabia are for the adopted budget, rather than actual expenditure.
  6. Figures for Israel do not include spending on paramilitary forces.
  7. Figures for Japan do not include military pensions.
  8. Figures for the USA are for financial year (1 October to 30 September of stated year).
  9. Figures for China are estimates, including estimates for items not in the official defense budget.
  10. Figures for South Korea do not include spending on relocations and welfare of $974 million dollars.
  11. Figures for Italy include spending on civil defence, which typically amounts to 4.5% of the total.
  12. Figures for United Arab Emirates are uncertain and lacking in transparency. The only available source of data is from the IMF.

Sources

  • SIPRI Military Expenditure Database 2011, http://milexdata.sipri.org.
  • Dollars per capita were calculated using 2010 populations via Wolfram Alpha.
  • U.S. military budget percentages from Wikipedia, accessed 4 June 2011.
  • DoD photo by Chief Warrant Officer 2nd Class Clinton W. Runyon, U.S. Marine Corps.

Rickety signature

Filed Under: Military, Rickety Picks Tagged With: Defense Spending, GDP

Spiral Jetty

May 15, 2011 by rickety 11 Comments

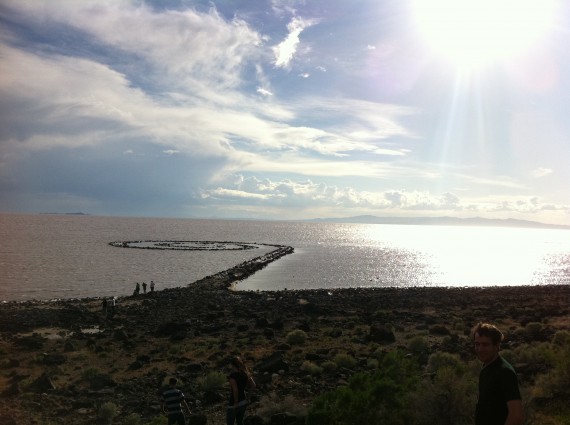
Spiral Jetty from shore

Spiral Jetty seen from the shore

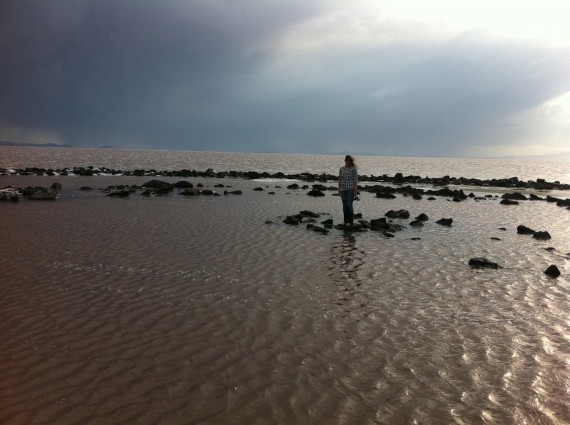
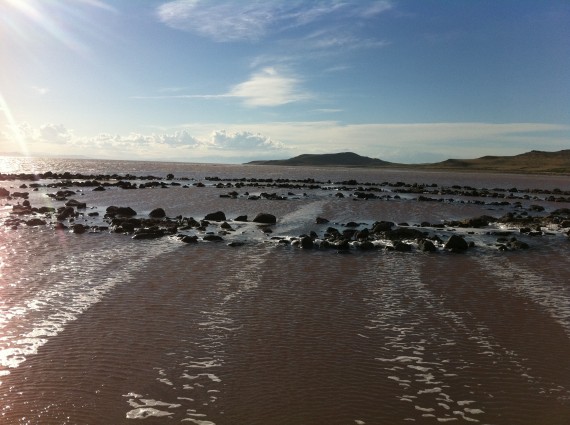
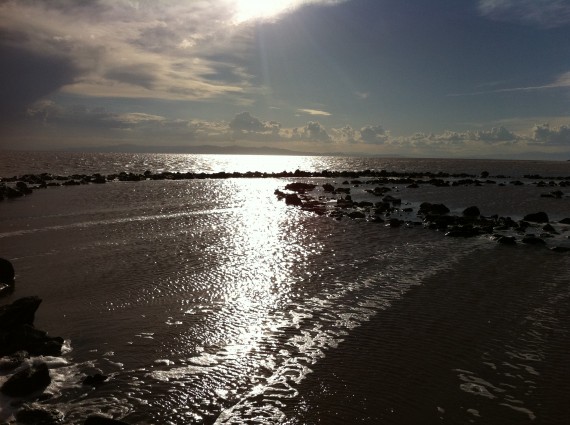
Last November Paul and I visited Spiral Jetty at Rozel Point. Then the Jetty was several hundred feet away from the waters of the Great Salt Lake. Yesterday Paul revisited Spiral Jetty, accompanied by Megan, with Julie and Dan. They found the Jetty almost submerged. Compare the photographs of the Jetty from November of last year with the ones that are published here.

Spiral Jetty outer arm

Daniel standing on the outer spiral of the Jetty

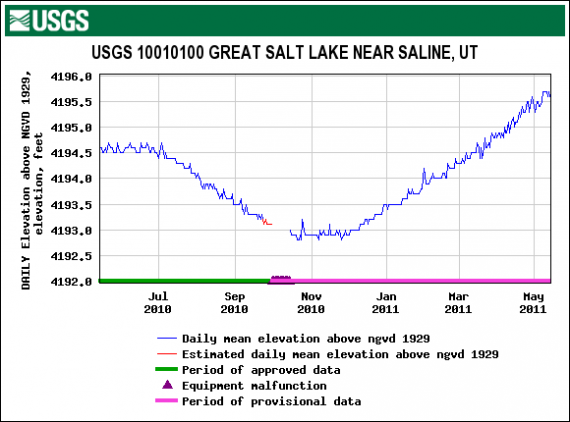
The graph below shows a year of daily readings up until Paul’s visit yesterday. The water level has risen over a foot from the same day last year and nearly three feet from our last visit in November. NGVD 29 is the National Geodetic Vertical Datum of 1929 and is a hybrid model closely representing the mean sea level. Note that the equipment malfunctioned near the low readings and appears to have taken at least two weeks to repair.

Great Salt Lake daily mean elevation

Readings from 14 May 2010 to 14 May 2011

The historical average level of Great Salt Lake is 4,200 feet. Spiral Jetty is only visible when the level of Great Salt Lake drops below 4,197.8 feet. The maximum elevation of the lake was 4,211.6 feet, seen in 1986 and 1987. The minimum elevation was in 1963 at 4,191.35 feet.

Spiral Jetty center

Megan stands at the center of Spiral Jetty

Great Salt Lake is the largest U.S. lake west of the Mississippi River and the 4th largest terminal lake (no outlet) in the world. It is about 75 miles long and 28 miles wide, and covers 1,700 square miles with a maximum depth of about 35 feet. A remnant of Lake Bonneville, a prehistoric freshwater lake that was 10 times larger than Great Salt Lake. It is typically three to five times saltier than the ocean.

Spiral Jetty almost submerged

Spiral Jetty is almost submerged

Paul reports that the rough trail to Spiral Jetty has been graded and resurfaced and is now a smooth drive. A parking lot has been built near the Jetty. I suspect that those who do not visit the Spiral Jetty soon will have nothing to see for perhaps another three decades.

Spiral Jetty overcast

This may be the last you will see of Spiral Jetty for a time

Credits

  • Photographs: Courtesy Megan Street and her iPhone
  • Graph: U.S. Geological Survey
  • Hat tip to Paul for the idea of a follow up Spiral Jetty post

Rickety signature

Filed Under: Daniel, Fun in Utah, Megan, Paul, Rickety Picks Tagged With: Art

  • « Previous Page
  • 1
  • 2
  • 3
  • 4
  • …
  • 10
  • Next Page »

Recent Comments

  • Anonymous on Arduino AVR High-Voltage Serial Programmer
  • Anonymous on The Twelve Stones of The Apocalypse
  • Randall on Parrish Canyon Fremont Pictographs
  • Jon on Testing Our APack Ready Meals
  • Jennifer Danelle Sexton on Missionary Dan Email #3 from Ulaanbaatar, Mongolia
  • Anonymous on The Twelve Stones of The Apocalypse
  • Anonymous on The Twelve Stones of The Apocalypse
  • Anonymous on The Twelve Stones of The Apocalypse
  • Bl on The Twelve Stones of The Apocalypse
  • ken on Arduino AVR High-Voltage Serial Programmer

Who is this Rickety?

Rick at homeI'm Rick Willoughby. I live in Utah, a retired Software Engineer. I'm a Mormon, married with 5 children and 12 grandchildren.

I emigrated from England in my late twenties, bringing with me one small suitcase and a few dollars. I appreciate the opportunities America has given me and the friendliness of the people to new citizens.

I blog about my family as well as politics, religion, finance, technology, and other topics.

Copyright © 2023 · Lifestyle Pro Theme on Genesis Framework · WordPress · Log in