• Blog
  • LDS
    • Canada
    • Japan
    • U.K.
    • U.S.
    • World
    • Politicians
  • Site
    • About
    • Archive
    • Best of Rickety
    • Comments Policy
    • Copyright
    • FAQ
    • Feedback
    • Guests
    • Privacy Policy
    • Technical
    • Why Blog?
  • Sundry
    • Comics
    • HyperCheese Help
    • JFHE
    • Projects
      • Book of Mormon
    • Wishful Thinking

Rickety

Mostly about Utah

  • Family
    • Jill
    • Rick
    • Children
      • Daniel
      • Jake
      • Paul
      • Sarah
      • Steven
    • Children’s Spouses
      • Adelaide
      • Derek
      • Megan
      • Rachel
      • Shelese
    • Grandchildren
      • Aurora
      • Benjamin
      • Bryson
      • Caleb
      • Calvin
      • Cassandra
      • Elizabeth
      • Ezra
      • Helen
      • Jameson
      • Ryan
      • Sadie
  • Finance
    • Bank Rewards Checking
    • Credit Union Rewards Checking
    • Debt
    • Employment
    • Money
    • Rewards Checking Posts
  • Government
    • City
    • Elections
    • Federal
    • Military
    • Paul on Politics
    • Politics
    • States
    • Taxes
  • Recreation
    • Competition
    • Food
    • Fun in Utah
    • Games
    • Music
    • Parade
    • Sports
    • Travel
  • Religion
    • Christmas
    • Family History
    • Jesus Christ
    • LDS
    • Marriage
    • Missionary
    • On Religion
    • Preparedness
    • Scriptures
    • Temple
  • Series
    • 100 Years Ago
    • Christmas Letter
    • Epic Excerpts
    • On Religion
    • Past Pictures
    • Daniel’s Mission
    • Jake’s Mission
    • Paul’s Mission
  • Technology
    • Applications
    • Blogging
    • Communication
    • Computer
    • Energy
    • Environment
    • How To
    • Photography
    • Population
    • Transportation

2010 Defense Spending by Country

June 4, 2011 by rickety 24 Comments

2010 Defense Spending by Country

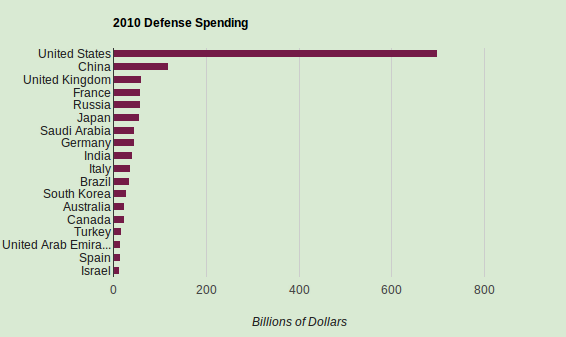
The eighteen countries with the largest military budgets. See table below for actual dollar amounts.

Military Expenditures

The eighteen nations with the largest military budgets in 2010 are shown in the chart above (click to enlarge). The United States, with a budget of $698 billion, spends more on defense than the next seventeen nations combined. The United States military spending is almost six times that of the next biggest spender, China ($119 billion) and more than eleven times that of Russia ($59 billion).

The Department of Defense budget in fiscal year 2010 accounted for 19% of the United States federal budget and 28% of estimated tax revenues. The U.S. accounts for 40% of the world’s yearly defense outlays.

Defense Spending by GDP – Top Ten Countries

Patrol near Combat Outpost Castle, Helmand province, Afghanistan

U.S. Marine patrol, Combat Outpost Castle, Afghanistan

  1. Eritrea 20.9%
  2. Saudi Arabia 11.2%
  3. Oman 9.7%
  4. United Arab Emirates 7.3%
  5. Timor Leste 6.8%
  6. Israel 6.3%
  7. Chad 6.2%
  8. Jordan 6.1%
  9. Georgia 5.6%
  10. Iraq 5.4 %

When spending is considered by percent of gross domestic product (GDP), the United States is not even in the top ten. At 4.7% of GDP the U.S. falls to eleventh place.

Six of the ten countries listed are in the Middle East where there are sharp regional tensions. The fear of conventional military attack is very real which helps justify high defense spending.

Internal instability is a growing factor and is a threat to the existing power structure within states, as demonstrated by recent uprisings in Tunisia, Egypt, Libya, and other Middle East countries.

GDP percentages are for 2009, except for Eritrea (2003). The list contains seven countries that do not appear in the table below because their total military spending is lower than the top thirty nations.

Table Of Defense Spending – Top 30 Countries in 2010

Click ONCE on column headers to sort.

Country $billion1 $ Rank %GDP2 %GDP Rank3 $ Per Capita
United States4 & 8 698.3 1 4.7 11 2,260
China9 119.4 2 2.2 55 88
United Kingdom 59.6 3 2.7 45 963
France 59.3 4 2.5 47 915
Russia 58.7 5 4.3 14 419
Japan7 54.5 6 1.0 129 429
Saudi Arabia5 45.2 7 11.2 2 1,727
Germany 45.2 8 1.4 99 550
India 41.3 9 2.8 42 34
Italy11 37.0 10 1.8 77 615
Brazil 33.5 11 1.6 88 172
South Korea10 27.6 12 2.9 39 569
Australia 24.0 13 1.9 70 1,115
Canada 22.8 14 1.5 91 672
Turkey 17.5 15 2.7 44 231
United Arab Emirates12 16.1 16 7.3 4 3,410
Spain 15.4 17 1.1 122 339
Israel6 14.0 18 6.3 6 1,929
Netherlands 11.2 19 1.5 93 671
Colombia 10.7 20 3.7 25 232
Greece 9.4 21 3.2 34 835
Taiwan 9.1 22 2.4 49 395
Poland 8.9 23 1.8 78 234
Singapore 8.4 24 4.3 13 1,736
Indonesia 7.2 25 0.9 136 31
Chile5 6.9 26 3.5 28 404
Norway 6.7 27 1.6 87 1,385
Algeria 5.7 28 3.8 21 160
Pakistan 5.6 29 2.8 43 31
Sweden 5.6 30 1.2 118 607


Notes

  1. Figures are in US $billions at 2010 prices and exchange rates.
  2. Percent GDP is for 2009.
  3. Percent GDP ranking is included because high expenditure countries are not necessarily spending at high percent of GDP.
  4. $159.3 billion of the U.S. budget is for “Overseas Contingency Operations,” to fight the wars in Afghanistan and Iraq.
  5. Figures for Chile and Saudi Arabia are for the adopted budget, rather than actual expenditure.
  6. Figures for Israel do not include spending on paramilitary forces.
  7. Figures for Japan do not include military pensions.
  8. Figures for the USA are for financial year (1 October to 30 September of stated year).
  9. Figures for China are estimates, including estimates for items not in the official defense budget.
  10. Figures for South Korea do not include spending on relocations and welfare of $974 million dollars.
  11. Figures for Italy include spending on civil defence, which typically amounts to 4.5% of the total.
  12. Figures for United Arab Emirates are uncertain and lacking in transparency. The only available source of data is from the IMF.

Sources

  • SIPRI Military Expenditure Database 2011, http://milexdata.sipri.org.
  • Dollars per capita were calculated using 2010 populations via Wolfram Alpha.
  • U.S. military budget percentages from Wikipedia, accessed 4 June 2011.
  • DoD photo by Chief Warrant Officer 2nd Class Clinton W. Runyon, U.S. Marine Corps.

Rickety signature

Filed Under: Military, Rickety Picks Tagged With: Defense Spending, GDP

2009 Defense Spending by Country

January 25, 2011 by rickety 3 Comments

Defense Spending by Country

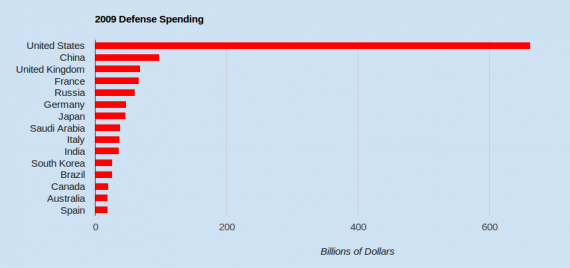
The fifteen countries with the largest annual military budgets. See table below for actual dollar amounts.

Note: This post has been superseded. See 2010 Defense Spending by Country.

Billions and Billions

The fifteen nations with the largest annual military budgets are shown in the chart above (click to enlarge). The United States, with a budget of $636 billion annually, spends more on defense than the next sixteen nations combined. The United States military spending is more than six times that of the next biggest spender, China ($99 billion) and ten times that of Russia ($61 billion). The U.S. accounts for 43% of the world’s yearly defense outlays.

Annual military expenditures by NATO, of which the U.S. is a member, total over one trillion dollars.

Defense Spending by GDP and Per Capita

Soldier in IraqWhen spending is considered by percent of gross domestic product (GDP), the United States at 4.3% falls to eleventh place. Eritrea (20.9%), Georgia (8.5%), and Saudi Arabia (8.2%) take the top spots. Note that Eritrea, Georgia, and some other countries with higher percent GDP spending that the United States do not all appear in the table below.

The highest per capita spending is by United Arab Emirates ($2,653), the United States ($2,142), and Israel ($1,882).

Table Of Annual Defense Spending By Country

Click ONCE on column headers to sort.

Rank Country $billion %GDP $ Per Capita
1 United States 663.3 4.3 2,141
2 China 98.8 2.0 75
3 United Kingdom 69.3 2.5 940
4 France 67.3 2.3 977
5 Russia 61.0 2.6 430
6 Germany 48.0 1.3 558
7 Japan 46.9 0.9 401
8 Saudi Arabia 39.3 8.2 1,524
9 Italy 37.4 1.7 593
10 India 36.6 2.6 31
11 South Korea 27.1 2.8 493
12 Brazil 27.1 1.5 142
13 Canada 20.6 1.3 560
14 Australia 20.1 1.8 893
15 Spain 19.4 1.2 398
16 Turkey 19.0 2.2 244
17 Israel 14.3 7.0 1,882
18 Greece 13.9 3.6 1,230
19 United Arab Emirates 13.0 5.9 2,653
20 Netherlands 12.6 1.4 759
21 Poland 10.9 2.0 285
22 Colombia 10.1 3.7 77
23 Taiwan 9.9 2.1 335
24 Iran 9.2 2.7 65
25 Singapore 8.0 4.1 1,003
26 Sweden 6.1 1.3 657
27 Norway 6.1 1.3 1,245
28 Chile 5.7 3.5 212
29 Algeria 5.7 3.0 77
30 Belgium 5.7 1.2 525

Notes

  1. Military spending is for 2009 but in 2008 dollars.
  2. Percent GDP is for 2008, except for Eritrea (not shown in table) which is for 2003.
  3. Nearly one-quarter of the U.S. budget was associated with operations in Iraq and Afghanistan.
  4. Not all countries are listed.

Sources

  • Stockholm International Peace Research Institute, The SIPRI Military Expenditure Database
  • Wikipedia, List of countries by military expenditures per capita
  • DoD photograph by Staff Sgt. Daniel St. Pierre, U.S. Air Force

Rickety signature

Filed Under: Military Tagged With: Defense Spending, GDP

If Utah Was A Country

September 18, 2009 by rickety Leave a Comment

Qatar, Jamaica, and Ecuador flags.

If Utah was a country it would have a GDP of $105.7 billion. This would place Utah above Qatar’s GDP of $102.3 billion but below 32 other states and 55 other nations. But what is GDP and how is it measured?

Gross Domestic Product

The gross domestic product (GDP), a basic measure of an economy’s economic performance, is the market value of all final goods and services made within the borders of a nation in a year. The most common approach to measuring GDP is the expenditure method. This method states that GDP is equal to the total expenditures for all final goods and services produced within the country in a stipulated period of time (usually a 365-day year). Goods and services are consumption plus gross investment plus government spending plus exports minus imports.

For a state the counterpart to GDP is Gross State Product (GSP) and is a measurement of the economic output of a state or province. It is the sum of all value added by industries within the state. Bear in mind that flows of goods, services, labor, and capital across state boundaries are not measured very accurately as compared to nations.

Population

If Utah was a country its population of 2,736,424 would rank it above the nation of Jamaica with a population of 2,719,000. Utah ranks 34th among the states in population. If Utah were a country, and no other U.S. states were, it would be positioned 139th in population among all nations.

Fertility

Fertility rate is live births per 1,000 women aged 15-44 years. The TFR (Total Fertility Rate) of a population is the average number of children that would be born to a woman over her lifetime. Bear in mind that the replacement fertility rate is roughly 2.1 births per woman for most industrialized countries.

If Utah was a country its fertility rate of 2.63 would rank above Ecuador’s 2.59 and would be higher than the world average of 2.61. If Utah were a country it would be 91st among the nations for fertility and ahead of all other U.S. states.

Summary

You can probably think of many more comparisons of Utah with other countries. Because the United States is such an economic powerhouse the GDP comparison is the most impressive, especially when comparing a larger state. The GDP of the United States ($14,264,600,000,000) is almost as great as the next four largest economies combined, which are those of Japan ($4,923,761,000,000), China ($4,401,614,000,000), Germany ($3,667,513,000,000), and France ($2,865,737,000,000).

One last item of note. If Utah was a country it would have a balanced budget.

Sources

Wikipedia: List of U.S. states by GDP (nominal). I used the 2008 GSP.
Wikipedia: List of countries by GDP (nominal). I used the 2008 list by the International Monetary Fund.
Wikipedia: List of countries by population.
Wikipedia: List of U.S. states by population.
United States Total Fertility Rate Increases. I used the 2006 rates.
Wikipedia: List of countries and territories by fertility rate. I used the 2008 CIA TFR rankings.
Rickety signature

Filed Under: States Tagged With: GDP, Utah

Defense Spending by Country

June 20, 2009 by rickety 16 Comments

Defense Spending

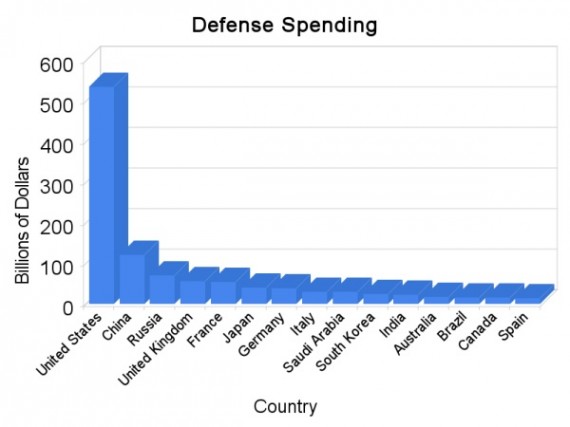
The fifteen countries with the largest annual military budgets. See table below for actual dollar amounts.

This information is outdated. See this post for the latest in military spending.

Defense Spending In The Billions

The chart above shows the fifteen nations with the greatest annual military spending. The United States, with a budget of $535.9 billion annually, spends more on defense than the next fourteen nations combined. One wonders if all that spending by the United States is really necessary, considering that the U.S. military budget is more than four times that of the next largest spender, China, at $121.9 billion. If America’s NATO allies are included just from the chart above (which is not all of NATO), that adds another $207.2 billion in defense spending. Those countries are the United Kingdom, France, Germany, Italy, Canada, and Spain.

Defense Spending By GDP

When spending is considered by percent of gross domestic product (GDP), the United States at 4.1% falls to eighth place. Saudi Arabia (10.0%), Russia (9.9%), and Israel (7.3%) take over first, second, and third place respectively.

Table Of Annual Defense Spending By Country

Click ONCE on column headers to sort.

Rank Country $Billion %GDP
1 United States 535.9 4.1
2 China 121.9 4.3
3 Russia 70.0 9.9
4 United Kingdom 55.4 2.4
5 France 54.0 2.6
6 Japan 41.1 0.8
7 Germany 37.8 1.5
8 Italy 30.6 1.8
9 Saudi Arabia 29.5 10.0
10 South Korea 24.6 2.7
11 India 22.4 2.5
12 Australia 17.2 2.4
13 Brazil 16.2 2.6
14 Canada 15.0 1.1
15 Spain 14.4 1.2
16 Turkey 11.6 5.3
17 Israel 11.0 7.3
18 Netherlands 9.9 1.6
19 United Arab Emirates 9.5 3.1
20 Indonesia 8.4 3.0
21 Taiwan 7.7 2.2
22 Greece 7.3 4.3
23 Iran 7.2 2.5
24 Myanmar (Burma) 6.9 2.1
25 Singapore 6.3 4.9
26 Poland 6.2 1.7
27 Ukraine 6.0 1.4
28 Sweden 5.8 1.5
29 Colombia 5.4 3.4
30 Norway 5.0 1.9

Sources

  • The Economist, “…and Wars”. Pocket World in Figures 2009 Edition. Profile Books. Dollar amounts are for 2006, except Indonesia which is for 2005.
  • The CIA World Factbook, listing spending on defense programs for the most recent year available as a percent of gross domestic product (GDP); the GDP is calculated on an exchange rate basis, i.e., not in terms of purchasing power parity (PPP).

Rickety signature

Filed Under: Military Tagged With: Defense Spending, GDP

Recent Comments

  • Anonymous on Arduino AVR High-Voltage Serial Programmer
  • Anonymous on The Twelve Stones of The Apocalypse
  • Randall on Parrish Canyon Fremont Pictographs
  • Jon on Testing Our APack Ready Meals
  • Jennifer Danelle Sexton on Missionary Dan Email #3 from Ulaanbaatar, Mongolia
  • Anonymous on The Twelve Stones of The Apocalypse
  • Anonymous on The Twelve Stones of The Apocalypse
  • Anonymous on The Twelve Stones of The Apocalypse
  • Bl on The Twelve Stones of The Apocalypse
  • ken on Arduino AVR High-Voltage Serial Programmer

Who is this Rickety?

Rick at homeI'm Rick Willoughby. I live in Utah, a retired Software Engineer. I'm a Mormon, married with 5 children and 12 grandchildren.

I emigrated from England in my late twenties, bringing with me one small suitcase and a few dollars. I appreciate the opportunities America has given me and the friendliness of the people to new citizens.

I blog about my family as well as politics, religion, finance, technology, and other topics.

Copyright © 2023 · Lifestyle Pro Theme on Genesis Framework · WordPress · Log in