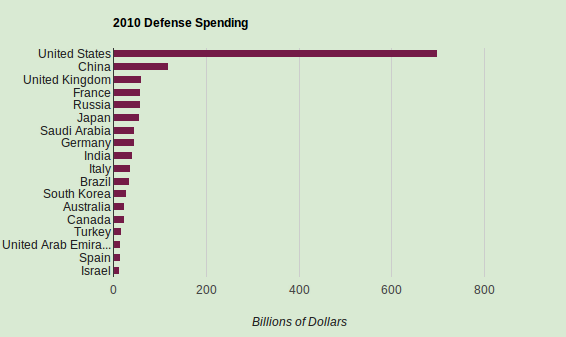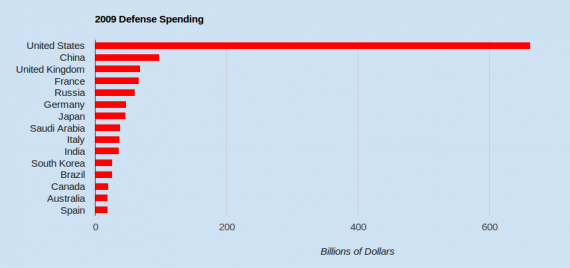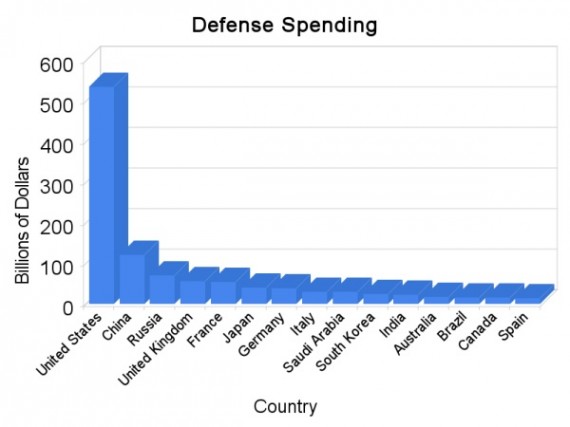
The eighteen countries with the largest military budgets. See table below for actual dollar amounts.
Military Expenditures
The eighteen nations with the largest military budgets in 2010 are shown in the chart above (click to enlarge). The United States, with a budget of $698 billion, spends more on defense than the next seventeen nations combined. The United States military spending is almost six times that of the next biggest spender, China ($119 billion) and more than eleven times that of Russia ($59 billion).
The Department of Defense budget in fiscal year 2010 accounted for 19% of the United States federal budget and 28% of estimated tax revenues. The U.S. accounts for 40% of the world’s yearly defense outlays.
Defense Spending by GDP – Top Ten Countries
- Eritrea 20.9%
- Saudi Arabia 11.2%
- Oman 9.7%
- United Arab Emirates 7.3%
- Timor Leste 6.8%
- Israel 6.3%
- Chad 6.2%
- Jordan 6.1%
- Georgia 5.6%
- Iraq 5.4 %
When spending is considered by percent of gross domestic product (GDP), the United States is not even in the top ten. At 4.7% of GDP the U.S. falls to eleventh place.
Six of the ten countries listed are in the Middle East where there are sharp regional tensions. The fear of conventional military attack is very real which helps justify high defense spending.
Internal instability is a growing factor and is a threat to the existing power structure within states, as demonstrated by recent uprisings in Tunisia, Egypt, Libya, and other Middle East countries.
GDP percentages are for 2009, except for Eritrea (2003). The list contains seven countries that do not appear in the table below because their total military spending is lower than the top thirty nations.
Table Of Defense Spending – Top 30 Countries in 2010
Click ONCE on column headers to sort.
| Country | $billion1 | $ Rank | %GDP2 | %GDP Rank3 | $ Per Capita |
|---|---|---|---|---|---|
| United States4 & 8 | 698.3 | 1 | 4.7 | 11 | 2,260 |
| China9 | 119.4 | 2 | 2.2 | 55 | 88 |
| United Kingdom | 59.6 | 3 | 2.7 | 45 | 963 |
| France | 59.3 | 4 | 2.5 | 47 | 915 |
| Russia | 58.7 | 5 | 4.3 | 14 | 419 |
| Japan7 | 54.5 | 6 | 1.0 | 129 | 429 |
| Saudi Arabia5 | 45.2 | 7 | 11.2 | 2 | 1,727 |
| Germany | 45.2 | 8 | 1.4 | 99 | 550 |
| India | 41.3 | 9 | 2.8 | 42 | 34 |
| Italy11 | 37.0 | 10 | 1.8 | 77 | 615 |
| Brazil | 33.5 | 11 | 1.6 | 88 | 172 |
| South Korea10 | 27.6 | 12 | 2.9 | 39 | 569 |
| Australia | 24.0 | 13 | 1.9 | 70 | 1,115 |
| Canada | 22.8 | 14 | 1.5 | 91 | 672 |
| Turkey | 17.5 | 15 | 2.7 | 44 | 231 |
| United Arab Emirates12 | 16.1 | 16 | 7.3 | 4 | 3,410 |
| Spain | 15.4 | 17 | 1.1 | 122 | 339 |
| Israel6 | 14.0 | 18 | 6.3 | 6 | 1,929 |
| Netherlands | 11.2 | 19 | 1.5 | 93 | 671 |
| Colombia | 10.7 | 20 | 3.7 | 25 | 232 |
| Greece | 9.4 | 21 | 3.2 | 34 | 835 |
| Taiwan | 9.1 | 22 | 2.4 | 49 | 395 |
| Poland | 8.9 | 23 | 1.8 | 78 | 234 |
| Singapore | 8.4 | 24 | 4.3 | 13 | 1,736 |
| Indonesia | 7.2 | 25 | 0.9 | 136 | 31 |
| Chile5 | 6.9 | 26 | 3.5 | 28 | 404 |
| Norway | 6.7 | 27 | 1.6 | 87 | 1,385 |
| Algeria | 5.7 | 28 | 3.8 | 21 | 160 |
| Pakistan | 5.6 | 29 | 2.8 | 43 | 31 |
| Sweden | 5.6 | 30 | 1.2 | 118 | 607 |
Notes
- Figures are in US $billions at 2010 prices and exchange rates.
- Percent GDP is for 2009.
- Percent GDP ranking is included because high expenditure countries are not necessarily spending at high percent of GDP.
- $159.3 billion of the U.S. budget is for “Overseas Contingency Operations,” to fight the wars in Afghanistan and Iraq.
- Figures for Chile and Saudi Arabia are for the adopted budget, rather than actual expenditure.
- Figures for Israel do not include spending on paramilitary forces.
- Figures for Japan do not include military pensions.
- Figures for the USA are for financial year (1 October to 30 September of stated year).
- Figures for China are estimates, including estimates for items not in the official defense budget.
- Figures for South Korea do not include spending on relocations and welfare of $974 million dollars.
- Figures for Italy include spending on civil defence, which typically amounts to 4.5% of the total.
- Figures for United Arab Emirates are uncertain and lacking in transparency. The only available source of data is from the IMF.
Sources
- SIPRI Military Expenditure Database 2011, http://milexdata.sipri.org.
- Dollars per capita were calculated using 2010 populations via Wolfram Alpha.
- U.S. military budget percentages from Wikipedia, accessed 4 June 2011.
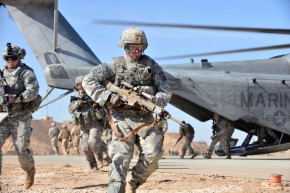
- DoD photo by Chief Warrant Officer 2nd Class Clinton W. Runyon, U.S. Marine Corps.


