• Blog
  • LDS
    • Canada
    • Japan
    • U.K.
    • U.S.
    • World
    • Politicians
  • Site
    • About
    • Archive
    • Best of Rickety
    • Comments Policy
    • Copyright
    • FAQ
    • Feedback
    • Guests
    • Privacy Policy
    • Technical
    • Why Blog?
  • Sundry
    • Comics
    • HyperCheese Help
    • JFHE
    • Projects
      • Book of Mormon
    • Wishful Thinking

Rickety

Mostly about Utah

  • Family
    • Jill
    • Rick
    • Children
      • Daniel
      • Jake
      • Paul
      • Sarah
      • Steven
    • Children’s Spouses
      • Adelaide
      • Derek
      • Megan
      • Rachel
      • Shelese
    • Grandchildren
      • Aurora
      • Benjamin
      • Bryson
      • Caleb
      • Calvin
      • Cassandra
      • Elizabeth
      • Ezra
      • Helen
      • Jameson
      • Ryan
      • Sadie
  • Finance
    • Bank Rewards Checking
    • Credit Union Rewards Checking
    • Debt
    • Employment
    • Money
    • Rewards Checking Posts
  • Government
    • City
    • Elections
    • Federal
    • Military
    • Paul on Politics
    • Politics
    • States
    • Taxes
  • Recreation
    • Competition
    • Food
    • Fun in Utah
    • Games
    • Music
    • Parade
    • Sports
    • Travel
  • Religion
    • Christmas
    • Family History
    • Jesus Christ
    • LDS
    • Marriage
    • Missionary
    • On Religion
    • Preparedness
    • Scriptures
    • Temple
  • Series
    • 100 Years Ago
    • Christmas Letter
    • Epic Excerpts
    • On Religion
    • Past Pictures
    • Daniel’s Mission
    • Jake’s Mission
    • Paul’s Mission
  • Technology
    • Applications
    • Blogging
    • Communication
    • Computer
    • Energy
    • Environment
    • How To
    • Photography
    • Population
    • Transportation

The Limits To Population Projections

March 20, 2011 by rickety 6 Comments

Aurora, Cassandra, and Bryson

Grandchildren Aurora, Cassandra, and Bryson

I am intrigued by predictions of calamities that never materialized. For example, in the five decades leading up to the year 2000, I have lived through predictions of mass starvation, nuclear annihilation, and an ice age.

In 1972, The Club of Rome published a book entitled The Limits To Growth. In the foreword, on page 11, the authors identified “the five basic factors that determine, and therefore, ultimately limit, growth on this planet,” namely:

  1. Population
  2. Agricultural Production
  3. Natural Resources
  4. Industrial Production
  5. Pollution

“Super”-exponential Growth

In this post I am concerned only with population. Particularly the predictions the authors of The Limits To Growth made about population. The book goes into detail about exponential growth in general and as it applies to population:

In 1650 the population numbered about 0.5 billion, and it was growing at a rate of approximately 0.3 percent per year. That corresponds to a doubling time of nearly 250 years. In 1970 the population totaled 3.6 billion and the rate of growth was 2.1 percent per year. The doubling time at this growth rate is 33 years. Thus, not only has the population been growing exponentially, but the rate of growth has also been growing. We might say that the population growth has been “super”-exponential; the population curve is rising even faster than it would if growth were strictly exponential. (“The Nature of Exponential Growth,”The Limits To Growth, 1972, 34)

Clearly, “super”-exponential sounds very frightening. Indeed, of sufficient concern to cause governments to panic and adopt policies they would not normally endorse.

Intriguingly, in 1972, when “The Limits To Growth” was published, the growth rate of population was already in decline. Since that year the population growth rate has continually decreased to a rate that is almost half of the peak.

14.4 Billion People by 2030

Another warning from the book:

…we can look forward to a world population of around 7 billion persons in 30 more years [in the year 2000]. And if we continue to succeed in lowering mortality with no better success in lowering fertility than we have accomplished in the past, in 60 years there will be four people in the world for every one person living today. (The Limits To Growth, 38)

Taking the population as of 1970, which was 3.6 billion, and multiplying by 4, we arrive 60 years hence in 2030 with a predicted population of 14.4 billion people.

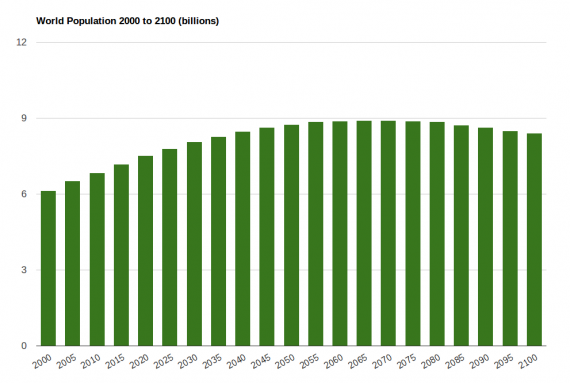
Now, using numbers from the International Institute for Applied Systems Analysis (IIASA), let us see where the population was in 2000 and look at projections to the year 2100. I am using the IIASA estimates because they closely align with the United Nations medium variant but go beyond 2050.

Population Growth Chart and Table

World Population Growth

Year Population Year Population
2000 6.12 2050 8.75
2005 6.51 2055 8.85
2010 6.82 2060 8.87
2015 7.17 2065 8.90
2020 7.51 2070 8.89
2025 7.79 2075 8.87
2030 8.05 2080 8.85
2035 8.26 2085 8.72
2040 8.47 2090 8.62
2045 8.63 2095 8.50
2100 8.39

Population in billions

Conclusions

Notice that the 2000 population prediction was off by one billion less. The 14.4 billion forecast in 2030 will not be reached with less than 19 years left. The current IIASA projection is for a population peak that is just shy of 9 billion by 2068. Thus the prediction from The Limits To Growth will come up short by a huge 5.4 billion people.

Granted, I am using a current projection to discredit a past projection. However, the record so far is to overestimate population growth. For example, China’s population is projected to peak at less than 1.4 billion in 2026, both earlier and at a lower level than previously projected.

I expect to see further revisions downward in the projections of population growth. Fertility rates have been falling for over sixty years and demographic momentum will shrink the world’s population just as quickly as it contributed to rapid growth.

We must not let outfits such as The Club of Rome dictate to governments unwise population policies based on dubious and inaccurate predictions of the future.

External Articles

This list is updated occasionally, with newer additions listed first.

  • Korea’s Total Fertility Rate Still Near the Bottom of the World — Ranks 217th among 222 countries.
  • Five myths about global population — Dispensing with some of the most common misconceptions.
  • 7 Billion People: What Population Control Advocates Don’t Say — Global fertility rates cut in half.
  • The End of Population Growth — Peak likely at 9 billion in the 2050’s.
  • Brazil’s Girl Power — Brazilian fertility rate is below the level at which a population replaces itself.
  • Taiwanese birth rate plummets despite measures — Taiwan has the world’s lowest fertility rate.
  • Economic turmoil taking its toll on childbearing — 18.8% of U.S. women ages 40-44 are childless.
  • The Problems of a Graying Population — The answer is to persuade families to have more children.
  • Cities built for young brace for aging public — By 2050, 1 in 5 Americans will be seniors.
  • Aging population rises while savings rate falls — Sri Lanka’s aging population is increasing.
  • Cuba’s Population Shrinking, Growing Old — Cuba is on course to dip below 11 million in 2032.
  • Beyond a Demographic Point of No Return — Elder dependent ratio will rise to over 60%.
  • Malawi fertility rate dropping — Total Fertility Rate has decreased by 0.6 percent.
  • A decline in U.S. births since 2007 — CDC reports 2010 births were 7 percent less than 2007.
  • The Long View of Feeding the Planet — Food-related climate doom has no historical foundation.
  • Population Implosion? — Government policies can slow fertility declines.
  • Older and wiser? — China scrambling to cope with the changing shape of its population.

Rickety signature

Filed Under: Rickety Picks Tagged With: Peak population, TFR, World

The Falling Populations of Europe

January 8, 2011 by rickety 2 Comments

Cassandra on Europe

Living in England in the sixties and seventies, I recall that there was great consternation among the scientists that overpopulation would doom Europe to starvation. It didn’t turn out that way.

Today no European country has a replacement total fertility rate of 2.1 and over half are below 1.5. Indeed the World total fertility rate has been falling for 60 years and will continue to do so.

Peak Population

In 2009 I highlighted the falling fertility of Europe. To see the real effect of falling fertility one can look at when populations will peak.

For Europeans, over a third of their countries have already passed their peak population. By 2050 over 75% of European countries will be peaked populations.

Of the twelve countries still to peak after 2050, only Turkey and the United Kingdom, it is estimated, will be growing at over 30,000 a year. In contrast, there will be nine countries that will be losing over 30,000 a year of their populations.

By 2050 European countries will be shedding 2.2 million people a year.

The Future of Europe

The future of European economies does not look promising as their populations fall. A declining population due to low fertility rates is accompanied by population aging. The young will have to increase per-capita output in order to support an infrastructure with costly, intensive care for the oldest among their population.

Many industrial economies have mortgaged the future by way of debt and retirement transfer payments that originally assumed rising tax revenues from a continually expanding population. As there would be fewer taxpayers in a declining population, this can contribute to a lower standard of living.

Because of labor shortages, labor-intensive sectors of the economy may be hurt if the shortage is severe enough. On the positive side, such a shortage increases the demand for labor, which can potentially result in a reduced unemployment rate as well as higher wages.


European Population Prospects

Click ONCE on column headers to sort.

Country1 Peak Year Peak 2010 2050 TFR Year Δ
Hungary 1980 10,707,000 9,973,000 8,934,000 1.34 -26,000
Bulgaria 1985 8,960,000 7,497,000 5,392,000 1.40 -52,000
Armenia 1990 3,545,000 3,090,000 3,018,000 1.35 -12,000
Bosnia & Herzegovina 1990 4,308,000 3,760,000 3,008,000 1.24 -28,000
Estonia 1990 1,567,000 1,339,000 1,233,000 1.42 -3,000
Georgia 1990 5,460,000 4,219,000 3,267,000 1.44 -28,000
Latvia 1990 2,663,000 2,240,000 1,854,000 1.29 -8,000
Lithuania 1990 3,698,000 3,255,000 2,579,000 1.22 -16,000
Romania 1990 23,207,000 21,190,000 17,279,000 1.38 -120,000
Ukraine 1990 51,583,000 45,433,000 35,026,000 1.25 -237,000
Belarus 1995 10,270,000 9,588,000 7,275,000 1.23 -67,000
Croatia 1995 4,669,000 4,410,000 3,825,000 1.41 -18,000
Moldova2 1995 4,432,603 4,317,483 3,635,357 1.26 -27,066
Poland 1995 38,595,000 38,038,000 32,013,000 1.27 -222,000
Russia 1995 148,497,000 140,367,000 116,097,000 1.40 -600,000
Serbia 1995 10,204,000 9,856,000 9,193,000 1.69 -28,000
Germany 2005 82,409,000 82,057,000 70,504,000 1.41 -400,000
Italy 2015 60,604,000 60,098,000 57,066,000 1.30 -162,000
Portugal 2015 10,787,000 10,732,000 10,015,000 1.49 -40,000
Greece 2020 11,284,000 11,183,000 10,939,000 1.36 -21,000
Slovakia 2020 5,442,000 5,412,000 4,917,000 1.34 -24,000
Slovenia 2020 2,053,000 2,025,000 1,954,000 1.27 -4,000
Andorra2 2025 85,112 84,525 74,765 1.32 -715
Czech Republic 2025 10,573,000 10,411,000 10,294,000 1.23 -8,000
Macedonia2 2025 2,119,511 2,072,086 1,990,728 1.58 -8,497
Albania 2030 3,416,000 3,169,000 3,303,000 2.02 -10,000
Finland 2030 5,544,000 5,346,000 5,445,000 1.73 -5,000
Liechtenstein2 2030 37,933 35,002 35,911 1.51 -37
Malta 2030 427,000 410,000 413,000 1.51 -1,000
Montenegro 2030 634,000 626,000 618,000 1.83 -1,000
Austria 2035 8,639,000 8,387,000 8,515,000 1.38 -11,000
Denmark 2035 5,621,000 5,481,000 5,551,000 1.74 -6,000
Monaco2 2035 32,550 30,586 29,810 1.75 -281
Netherlands 2035 17,572,000 16,653,000 17,399,000 1.66 -18,000
San Marino2 2040 36,311 31,477 35,178 1.35 -150
Azerbaijan 2045 10,614,000 8,934,000 10,579,000 2.05 -7,000
Iceland 2050 407,000 329,000 407,000 1.91 0
Belgium After 2050 After 2050 10,698,000 11,493,000 1.65 4,000
Cyprus After 2050 After 2050 880,000 1,175,000 1.79 6,000
France After 2050 After 2050 62,637,000 67,668,000 1.98 1,000
Ireland After 2050 After 2050 4,589,000 6,295,000 1.85 30,000
Kazakhstan After 2050 After 2050 15,753,000 17,848,000 1.88 9,000
Luxembourg After 2050 After 2050 492,000 733,000 1.78 6,000
Norway After 2050 After 2050 4,855,000 5,947,000 1.78 18,000
Spain After 2050 After 2050 45,317,000 51,260,000 1.30 27,000
Sweden After 2050 After 2050 9,293,000 10,571,000 1.67 26,000
Switzerland After 2050 After 2050 7,595,000 8,514,000 1.44 18,000
Turkey After 2050 After 2050 75,705,000 97,389,000 1.87 191,000
United Kingdom After 2050 After 2050 61,899,000 72,365,000 1.66 211,000

Table3 last updated January 8, 2011

Notes

1. The meaning of the column headers:

  • Country — All European countries except the Vatican.
  • Peak Year — The estimated population peak year, to a resolution of 5 years.
  • Peak — The estimated population peak.
  • 2010 — Essentially the current population.
  • 2050 — The estimated population in 2050.
  • TFR — The Total Fertility Rate is the average number of children that would be born to a woman over her lifetime.
  • Year Δ — The estimated yearly change in population from 2045 to 2050.

2. International Data Base, all others World Population Prospects.
3. The more conservative medium fertility variant was used for most countries. Fertility is assumed to converge eventually toward a level of 1.85 children per woman. However, not all countries reach this level by 2045-2050. Projection procedures differ slightly depending on whether a country had a total fertility above or below 1.85 children per woman in 2005-2010.

Sources

  • Population Division of the Department of Economic and Social Affairs of the United Nations Secretariat, World Population Prospects: The 2008 Revision, accessed January 8, 2011.
  • U.S. Census Bureau, International Data Base, accessed January 8, 2011.
  • Wikipedia, Economic Consequences of Population Decline, accessed January 8, 2011.

External Articles

This list is updated occasionally, with newer additions listed first.

  • The Shrinking North — Europe’s population will peak in the early 2020’s.
  • Seven billion strong — Expansion of the planet’s most precious resource: human ingenuity.
  • Census shows population decline — Greece’s population has shrunk by more than 1 percent.
  • Lithuanian census shows steep fall in population — Lost 700,000 people in 20 years.
  • 12 Countries Most Likely to Go Belly-Up — Includes 11 European countries.
  • Why the US outstrips Europe for population growth — Europe is less attractive to newcomers.
  • Thomas Malthus: Wrong Yesterday, Right Today? — Population is not the problem.
  • Could Demographic Trends Cripple Europe by 2050? — Demography is destiny.
  • Baby Gap: Germany’s Birth Rate Hits Historic Low — German birth rate drops to 1946 level.

Rickety signature.

Filed Under: Population, Rickety Picks Tagged With: Europe, Peak population, TFR

Recent Comments

  • Anonymous on One Hundred Thousand Milpengo
  • Jeremy McMullin on Mesa Easter Pageant – Jesus The Christ
  • Genma Vincent on George W Bush on Religion
  • Anonymous on The Twelve Stones of The Apocalypse
  • Judy Crowe on Ten Artists Paint Old Testament Women
  • Angela on The Twelve Stones of The Apocalypse
  • Angela on The Twelve Stones of The Apocalypse
  • AllHailKingJesus on The Twelve Stones of The Apocalypse
  • Microwave guy on Make a Halloween Costume from a Microwave Oven
  • Anonymous on Arduino AVR High-Voltage Serial Programmer

Who is this Rickety?

Rick at homeI'm Rick Willoughby. I live in Utah, a retired Software Engineer. I'm a Mormon, married with 5 children and 12 grandchildren.

I emigrated from England in my late twenties, bringing with me one small suitcase and a few dollars. I appreciate the opportunities America has given me and the friendliness of the people to new citizens.

I blog about my family as well as politics, religion, finance, technology, and other topics.

Copyright © 2025 · Lifestyle Pro Theme on Genesis Framework · WordPress · Log in