• Blog
  • LDS
    • Canada
    • Japan
    • U.K.
    • U.S.
    • World
    • Politicians
  • Site
    • About
    • Archive
    • Best of Rickety
    • Comments Policy
    • Copyright
    • FAQ
    • Feedback
    • Guests
    • Privacy Policy
    • Technical
    • Why Blog?
  • Sundry
    • Comics
    • HyperCheese Help
    • JFHE
    • Projects
      • Book of Mormon
    • Wishful Thinking

Rickety

Mostly about Utah

  • Family
    • Jill
    • Rick
    • Children
      • Daniel
      • Jake
      • Paul
      • Sarah
      • Steven
    • Children’s Spouses
      • Adelaide
      • Derek
      • Megan
      • Rachel
      • Shelese
    • Grandchildren
      • Aurora
      • Benjamin
      • Bryson
      • Caleb
      • Calvin
      • Cassandra
      • Elizabeth
      • Ezra
      • Helen
      • Jameson
      • Ryan
      • Sadie
  • Finance
    • Bank Rewards Checking
    • Credit Union Rewards Checking
    • Debt
    • Employment
    • Money
    • Rewards Checking Posts
  • Government
    • City
    • Elections
    • Federal
    • Military
    • Paul on Politics
    • Politics
    • States
    • Taxes
  • Recreation
    • Competition
    • Food
    • Fun in Utah
    • Games
    • Music
    • Parade
    • Sports
    • Travel
  • Religion
    • Christmas
    • Family History
    • Jesus Christ
    • LDS
    • Marriage
    • Missionary
    • On Religion
    • Preparedness
    • Scriptures
    • Temple
  • Series
    • 100 Years Ago
    • Christmas Letter
    • Epic Excerpts
    • On Religion
    • Past Pictures
    • Daniel’s Mission
    • Jake’s Mission
    • Paul’s Mission
  • Technology
    • Applications
    • Blogging
    • Communication
    • Computer
    • Energy
    • Environment
    • How To
    • Photography
    • Population
    • Transportation

Real Population Density

July 4, 2011 by rickety 2 Comments

Boise Valley wheat field

Boise Valley, Idaho wheat field around 1920

In the United States, in these times of high unemployment, increasing deficits, and seemingly endless wars, it would be well to count our blessings. One such blessing is the bounteous land in which we live. The United States has more arable land than any other country. Even though the United States is the third most populous nation on Earth, her Real Population Density ranks as twelfth least dense of all nations.

As the world’s population increases and ever more demands are placed on the food supply, am I thankful to be living in the United States. Let me explain some of the terms associated with real population density and show you the favorable numbers for the U.S.A.

Arable Land

Agricultural area includes land suitable for crops and livestock. The standard classification, used by Food and Agriculture Organization of the United Nations, divides agricultural area into these components:

  • Arable Land — land under annual crops, such as cereals, potatoes, vegetables, and melons that are replanted after each harvest; also land left temporarily fallow.
  • Orchards and Vineyards — land under permanent crops such as citrus, coffee, and rubber that are not replanted after each harvest.
  • Meadows and Pastures — areas for natural grasses and grazing of livestock.

In 2008, the world’s total arable land amounted to 13,805,153 square kilometers, whereas 48,836,976 square kilometers was classified as agricultural land. In this post, we are focused on arable land. Of interest is this map of the world with arable land percentages showing the United States in the 15-19% range.

Real Population Density

Population density is the number of people per square kilometer. Real Population Density is the number of people per square kilometer of arable land. This enables us to see the capacity of a country to feed their own people.

Real Population Density is a much better measure than pure population density as it shows how a seemingly more densely populated country can carry a larger population because a much bigger portion of the land is suitable for agriculture.

For those of us used to thinking in acres, one square kilometer is equal to 247.1 acres.

Table of Countries by Real Population Density

Click ONCE on column headers to sort.

Rank  Country1 Real Density2 Population  Arable Land (km2)
1 Australia 48 22,268,000 468,503
2 Kazakhstan 72 16,026,000 221,059
3 Canada 82 34,017,000 415,573
4 Niger 107 15,512,000 144,784
5 Lithuania 114 3,324,000 29,216
6 Russia 117 142,958,000 1,218,599
7 Latvia 126 2,252,000 17,926
8 Ukraine 140 45,448,000 324,791
9 Argentina 147 40,412,000 274,490
10 Guyana 172 754,000 4,390
11 Belarus 173 9,595,000 55,575
12 United States 188 310,384,000 1,650,062
13 Moldova 196 3,573,000 18,194
14 Paraguay 218 6,455,000 29,678
15 Hungary 218 9,984,000 45,782
16 Bulgaria 226 7,494,000 33,099
17 Central African Republic 228 4,401,000 19,313
18 Turkmenistan 229 5,042,000 22,013
19 Mongolia 232 2,756,000 11,887
20 Romania 236 21,486,000 90,961
21 Denmark 249 5,550,000 22,295
22 Uruguay 250 3,369,000 13,490
23 Togo 251 6,028,000 24,038
24 Zambia 253 13,089,000 51,777
25 Estonia 258 1,341,000 5,207
26 Finland 269 5,365,000 19,913
27 Sudan 270 43,552,000 161,093
28 Namibia 279 2,283,000 8,172
29 New Zealand 294 4,368,000 14,848
30 Samoa 295 183,000 620
31 Serbia 299 9,856,000 32,990
32 Croatia 302 4,403,000 14,566
33 Poland 312 38,277,000 122,547
34 Turkey 317 72,752,000 229,764
35 Chad 318 11,227,000 35,258
36 Nicaragua 325 5,788,000 17,810
37 Bolivia 329 9,930,000 30,146
38 Brazil 333 194,946,000 586,036
39 Cameroon 333 19,599,000 58,868
40 Mali 335 15,370,000 45,872
41 Spain 339 46,077,000 135,776
42 South Africa 340 50,133,000 147,609
43 Benin 340 8,850,000 26,029
44 Burkina Faso 341 16,469,000 48,353
45 France 344 62,787,000 182,568
46 Czech Republic 350 10,493,000 29,999
47 Libya 351 6,355,000 18,123
48 Montenegro 363 631,000 1,740
49 Cuba 368 11,258,000 30,631
50 Bosnia and Herzegovina 375 3,760,000 10,026
51 Macedonia 377 2,061,000 5,471
52 Morocco 377 31,951,000 84,797
53 Slovakia 383 5,462,000 14,264
54 Sweden 385 9,380,000 24,368
55 Ireland 386 4,470,000 11,587
56 Cambodia 392 14,138,000 36,081
57 Zimbabwe 395 12,571,000 31,862
58 Tunisia 396 10,481,000 26,489
59 Afghanistan 400 31,412,000 78,542
60 Greece 425 11,359,000 26,749
61 Kyrgyzstan 426 5,334,000 12,530
62 Fiji 430 861,000 2,001
63 Syrian Arab Republic 447 20,411,000 45,644
64 Belize 448 312,000 696
65 Iran 462 73,974,000 160,001
66 Mexico 466 113,423,000 243,457
67 Algeria 470 35,468,000 75,501
68 Gabon 483 1,505,000 3,118
69 Myanmar 489 47,963,000 98,135
70 Thailand 490 69,122,000 140,941
71 Azerbaijan 518 9,188,000 17,754
72 Senegal 518 12,434,000 24,019
73 Nigeria 527 158,423,000 300,736
74 Botswana 527 2,007,000 3,805
75 Equatorial Guinea 539 700,000 1,299
76 Georgia 543 4,352,000 8,022
77 Mozambique 549 23,391,000 42,576
78 Iraq 559 31,672,000 56,700
79 Angola 578 19,082,000 33,038
80 Albania 582 3,204,000 5,507
81 Norway 587 4,883,000 8,312
82 Ghana 602 24,392,000 40,507
83 Côte d’Ivoire 607 19,738,000 32,531
84 Austria 614 8,394,000 13,677
85 Uzbekistan 614 27,445,000 44,710
86 Gambia 620 1,728,000 2,788
87 Panama 637 3,517,000 5,517
88 Armenia 649 3,092,000 4,766
89 Guinea-Bissau 651 1,515,000 2,327
90 Lesotho 658 2,171,000 3,300
91 Laos 670 6,201,000 9,255
92 Portugal 672 10,676,000 15,898
93 Bhutan 672 726,000 1,081
94 Swaziland 673 1,186,000 1,763
95 Madagascar 708 20,714,000 29,251
96 Germany 711 82,302,000 115,698
97 Honduras 713 7,601,000 10,663
98 Tonga 722 104,000 144
99 Tajikistan 739 6,879,000 9,304
100 Ethiopia 740 82,950,000 112,080
101 Malawi 766 14,901,000 19,456
102 Uganda 776 33,425,000 43,077
103 Italy 780 60,551,000 77,651
104 Peru 789 29,077,000 36,864
105 Republic of the Congo 816 4,043,000 4,952
106 Luxembourg 819 507,000 619
107 Saudi Arabia 838 27,448,000 32,742
108 India 844 1,224,614,000 1,451,809
109 Chile 872 17,114,000 19,619
110 Kenya 889 40,513,000 45,597
111 North Korea 903 24,346,000 26,972
112 Suriname 904 525,000 581
113 Eritrea 906 5,254,000 5,799
114 Somalia 907 9,331,000 10,288
115 Guinea 908 9,982,000 10,990
116 Pakistan 912 173,593,000 190,319
117 Dominican Republic 912 9,927,000 10,881
118 Timor-Leste 913 1,124,000 1,231
119 Ecuador 915 14,465,000 15,808
120 Burundi 919 8,383,000 9,124
121 Rwanda 935 10,624,000 11,366
122 Comoros 945 735,000 778
123 El Salvador 953 6,193,000 6,500
124 China 968 1,341,335,000 1,385,905
125 Guatemala 1,004 14,389,000 14,334
126 Dem Rep of Congo 1,017 65,966,000 64,853
127 Sierra Leone 1,031 5,868,000 5,694
128 Cape Verde 1,078 496,000 460
129 Cyprus 1,105 1,104,000 999
130 United Kingdom 1,105 62,036,000 56,121
131 Venezuela 1,153 28,980,000 25,138
132 Slovenia 1,181 2,030,000 1,719
133 Indonesia 1,191 239,871,000 201,456
134 Tanzania 1,196 44,841,000 37,479
135 Vanuatu 1,200 240,000 200
136 Liberia 1,209 3,994,000 3,304
137 Haiti 1,290 9,993,000 7,747
138 Belgium 1,290 10,712,000 8,302
139 Mauritius 1,306 1,299,000 995
140 Viet Nam 1,341 87,848,000 65,528
141 Nepal 1,363 29,959,000 21,984
142 Saint Vincent 1,557 109,000 70
143 Yemen 1,566 24,053,000 15,364
144 Malaysia 1,583 28,401,000 17,939
145 Jamaica 1,598 2,741,000 1,715
146 Philippines 1,646 93,261,000 56,652
147 Mauritania 1,679 3,460,000 2,061
148 Barbados 1,706 273,000 160
149 Trinidad and Tobago 1,788 1,341,000 750
150 Switzerland 1,945 7,664,000 3,941
151 Sao Tome and Principe 1,988 165,000 83
152 French Guiana 1,991 231,000 116
153 Bangladesh 2,005 148,692,000 74,173
154 Jordan 2,027 6,187,000 3,053
155 Costa Rica 2,090 4,659,000 2,229
156 Netherlands Antilles 2,094 201,000 96
157 Colombia 2,217 46,295,000 20,878
158 Netherlands 2,233 16,613,000 7,441
159 Guadeloupe 2,305 461,000 200
160 Sri Lanka 2,308 20,860,000 9,038
161 Israel 2,362 7,418,000 3,141
162 Réunion 2,424 846,000 349
163 Lebanon 2,527 4,228,000 1,673
164 Micronesia 2,775 111,000 40
165 Egypt 2,791 81,121,000 29,067
166 Japan 2,901 126,536,000 43,620
167 South Korea 2,960 48,184,000 16,280
168 Taiwan 2,979 23,061,689 7,742
169 Papua New Guinea 3,091 6,858,000 2,219
170 Solomon Islands 3,146 538,000 171
171 Brunei Darussalam 3,627 399,000 110
172 Palestinian Territory 3,821 4,039,000 1,057
173 Malta 4,212 417,000 99
174 Martinique 4,229 406,000 96
175 New Caledonia 4,254 251,000 59
176 Saint Lucia 4,462 174,000 39
177 Iceland 4,571 320,000 70
178 Grenada 5,200 104,000 20
179 Aruba 5,350 107,000 20
180 Virgin Islands 5,450 109,000 20
181 Bahamas 5,914 343,000 58
182 Maldives 7,900 316,000 40
183 Guam 9,000 180,000 20
184 Qatar 9,356 1,759,000 188
185 Western Sahara 10,019 531,000 53
186 French Polynesia 10,037 271,000 27
187 Oman 10,910 2,782,000 255
188 Puerto Rico 11,465 3,749,000 327
189 United Arab Emirates 11,774 7,512,000 638
190 Kuwait 18,247 2,737,000 150
191 Bahrain 66,421 1,262,000 19
192 Djibouti 98,778 889,000 9
193 Hong Kong 133,075 7,053,000 53
194 Singapore 508,600 5,086,000 10
195 Macao3 — 544,000 0


Notes

  1. Countries and territories of less than 100,000 in 2009 are not included.
  2. Real Density is population per square kilometer of arable land.
  3. Macao has no arable land, hence real population density is not calculated.

Sources

  • Population: United Nations, Department of Economic and Social Affairs, Population Division (2011): World Population Prospects: The 2010 Revision. New York, accessed July 4th, 2011.
  • Taiwan Population: Wikipedia, accessed July 4th, 2011. Taiwan is not recognized by the United Nations.
  • Arable Land: The World Factbook.
  • Photo Credit: Water Archives.

External Articles

This list is updated occasionally, with newer additions listed first.

  • How poverty has tracked global population — There’s nothing Malthusian going on here.

Rickety signature

Filed Under: Food, Population, Rickety Picks

The Falling Populations of Europe

January 8, 2011 by rickety 2 Comments

Cassandra on Europe

Living in England in the sixties and seventies, I recall that there was great consternation among the scientists that overpopulation would doom Europe to starvation. It didn’t turn out that way.

Today no European country has a replacement total fertility rate of 2.1 and over half are below 1.5. Indeed the World total fertility rate has been falling for 60 years and will continue to do so.

Peak Population

In 2009 I highlighted the falling fertility of Europe. To see the real effect of falling fertility one can look at when populations will peak.

For Europeans, over a third of their countries have already passed their peak population. By 2050 over 75% of European countries will be peaked populations.

Of the twelve countries still to peak after 2050, only Turkey and the United Kingdom, it is estimated, will be growing at over 30,000 a year. In contrast, there will be nine countries that will be losing over 30,000 a year of their populations.

By 2050 European countries will be shedding 2.2 million people a year.

The Future of Europe

The future of European economies does not look promising as their populations fall. A declining population due to low fertility rates is accompanied by population aging. The young will have to increase per-capita output in order to support an infrastructure with costly, intensive care for the oldest among their population.

Many industrial economies have mortgaged the future by way of debt and retirement transfer payments that originally assumed rising tax revenues from a continually expanding population. As there would be fewer taxpayers in a declining population, this can contribute to a lower standard of living.

Because of labor shortages, labor-intensive sectors of the economy may be hurt if the shortage is severe enough. On the positive side, such a shortage increases the demand for labor, which can potentially result in a reduced unemployment rate as well as higher wages.


European Population Prospects

Click ONCE on column headers to sort.

Country1 Peak Year Peak 2010 2050 TFR Year Δ
Hungary 1980 10,707,000 9,973,000 8,934,000 1.34 -26,000
Bulgaria 1985 8,960,000 7,497,000 5,392,000 1.40 -52,000
Armenia 1990 3,545,000 3,090,000 3,018,000 1.35 -12,000
Bosnia & Herzegovina 1990 4,308,000 3,760,000 3,008,000 1.24 -28,000
Estonia 1990 1,567,000 1,339,000 1,233,000 1.42 -3,000
Georgia 1990 5,460,000 4,219,000 3,267,000 1.44 -28,000
Latvia 1990 2,663,000 2,240,000 1,854,000 1.29 -8,000
Lithuania 1990 3,698,000 3,255,000 2,579,000 1.22 -16,000
Romania 1990 23,207,000 21,190,000 17,279,000 1.38 -120,000
Ukraine 1990 51,583,000 45,433,000 35,026,000 1.25 -237,000
Belarus 1995 10,270,000 9,588,000 7,275,000 1.23 -67,000
Croatia 1995 4,669,000 4,410,000 3,825,000 1.41 -18,000
Moldova2 1995 4,432,603 4,317,483 3,635,357 1.26 -27,066
Poland 1995 38,595,000 38,038,000 32,013,000 1.27 -222,000
Russia 1995 148,497,000 140,367,000 116,097,000 1.40 -600,000
Serbia 1995 10,204,000 9,856,000 9,193,000 1.69 -28,000
Germany 2005 82,409,000 82,057,000 70,504,000 1.41 -400,000
Italy 2015 60,604,000 60,098,000 57,066,000 1.30 -162,000
Portugal 2015 10,787,000 10,732,000 10,015,000 1.49 -40,000
Greece 2020 11,284,000 11,183,000 10,939,000 1.36 -21,000
Slovakia 2020 5,442,000 5,412,000 4,917,000 1.34 -24,000
Slovenia 2020 2,053,000 2,025,000 1,954,000 1.27 -4,000
Andorra2 2025 85,112 84,525 74,765 1.32 -715
Czech Republic 2025 10,573,000 10,411,000 10,294,000 1.23 -8,000
Macedonia2 2025 2,119,511 2,072,086 1,990,728 1.58 -8,497
Albania 2030 3,416,000 3,169,000 3,303,000 2.02 -10,000
Finland 2030 5,544,000 5,346,000 5,445,000 1.73 -5,000
Liechtenstein2 2030 37,933 35,002 35,911 1.51 -37
Malta 2030 427,000 410,000 413,000 1.51 -1,000
Montenegro 2030 634,000 626,000 618,000 1.83 -1,000
Austria 2035 8,639,000 8,387,000 8,515,000 1.38 -11,000
Denmark 2035 5,621,000 5,481,000 5,551,000 1.74 -6,000
Monaco2 2035 32,550 30,586 29,810 1.75 -281
Netherlands 2035 17,572,000 16,653,000 17,399,000 1.66 -18,000
San Marino2 2040 36,311 31,477 35,178 1.35 -150
Azerbaijan 2045 10,614,000 8,934,000 10,579,000 2.05 -7,000
Iceland 2050 407,000 329,000 407,000 1.91 0
Belgium After 2050 After 2050 10,698,000 11,493,000 1.65 4,000
Cyprus After 2050 After 2050 880,000 1,175,000 1.79 6,000
France After 2050 After 2050 62,637,000 67,668,000 1.98 1,000
Ireland After 2050 After 2050 4,589,000 6,295,000 1.85 30,000
Kazakhstan After 2050 After 2050 15,753,000 17,848,000 1.88 9,000
Luxembourg After 2050 After 2050 492,000 733,000 1.78 6,000
Norway After 2050 After 2050 4,855,000 5,947,000 1.78 18,000
Spain After 2050 After 2050 45,317,000 51,260,000 1.30 27,000
Sweden After 2050 After 2050 9,293,000 10,571,000 1.67 26,000
Switzerland After 2050 After 2050 7,595,000 8,514,000 1.44 18,000
Turkey After 2050 After 2050 75,705,000 97,389,000 1.87 191,000
United Kingdom After 2050 After 2050 61,899,000 72,365,000 1.66 211,000

Table3 last updated January 8, 2011

Notes

1. The meaning of the column headers:

  • Country — All European countries except the Vatican.
  • Peak Year — The estimated population peak year, to a resolution of 5 years.
  • Peak — The estimated population peak.
  • 2010 — Essentially the current population.
  • 2050 — The estimated population in 2050.
  • TFR — The Total Fertility Rate is the average number of children that would be born to a woman over her lifetime.
  • Year Δ — The estimated yearly change in population from 2045 to 2050.

2. International Data Base, all others World Population Prospects.
3. The more conservative medium fertility variant was used for most countries. Fertility is assumed to converge eventually toward a level of 1.85 children per woman. However, not all countries reach this level by 2045-2050. Projection procedures differ slightly depending on whether a country had a total fertility above or below 1.85 children per woman in 2005-2010.

Sources

  • Population Division of the Department of Economic and Social Affairs of the United Nations Secretariat, World Population Prospects: The 2008 Revision, accessed January 8, 2011.
  • U.S. Census Bureau, International Data Base, accessed January 8, 2011.
  • Wikipedia, Economic Consequences of Population Decline, accessed January 8, 2011.

External Articles

This list is updated occasionally, with newer additions listed first.

  • The Shrinking North — Europe’s population will peak in the early 2020’s.
  • Seven billion strong — Expansion of the planet’s most precious resource: human ingenuity.
  • Census shows population decline — Greece’s population has shrunk by more than 1 percent.
  • Lithuanian census shows steep fall in population — Lost 700,000 people in 20 years.
  • 12 Countries Most Likely to Go Belly-Up — Includes 11 European countries.
  • Why the US outstrips Europe for population growth — Europe is less attractive to newcomers.
  • Thomas Malthus: Wrong Yesterday, Right Today? — Population is not the problem.
  • Could Demographic Trends Cripple Europe by 2050? — Demography is destiny.
  • Baby Gap: Germany’s Birth Rate Hits Historic Low — German birth rate drops to 1946 level.

Rickety signature.

Filed Under: Population, Rickety Picks Tagged With: Europe, Peak population, TFR

Google Plots Fertility Rate

May 19, 2010 by rickety 1 Comment


If you cannot see the graph click here or here.

Google recently added the World Bank’s World Development Indicators to their existing US unemployment and US population data sets. The World Development Indicators consist of 17 data sets that Google plots as an interactive graph using their public data search. The graphs can be linked or embedded on a web page as I have done above. Note that in some data sets, a few countries do not have data, for example Andorran GDP growth rate.

In my graph I included the countries with the highest fertility rate (Niger, 7.0) and the lowest fertility rate (Bosnia and Herzegovina, 1.2). I show the U.S. at exactly the 2.1 replacement rate. The World fertility rate has dropped to 2.5.

Links to Data Sets

I found that I could not easily access the public data sets. I had to display them using the right words in a search. Once I discovered the URLs I could save the links and go directly to the graphs. The links are listed below that have the World Development Indicators made available through Google’s public statistical data search. Clicking a link will bring up a blank chart, allowing you to select one or more country’s data to display. I have included the U.S. population and unemployment public data sets for completeness.

  • CO2 emissions per capita
  • Electricity consumption per capita
  • Energy use per capita
  • Exports as percentage of GDP
  • Fertility rate
  • GDP deflator change
  • GDP growth rate
  • GNI per capita in PPP dollars
  • Gross Domestic Product
  • Gross National Income in PPP dollars
  • Imports as percentage of GDP
  • Internet users as percentage of population
  • Life expectancy
  • Military expenditure as percentage of GDP
  • Mortality rate, under 5
  • Population
  • Population growth rate
  • US population
  • US unemployment

External Articles

This list is updated occasionally, with newer additions listed first.

  • The challenges and opportunities that come with population growth and seven billion people
  • Population bomb bogus — The global economy is doing a fine job of alleviating poverty.

Updates

Google now has a Public Data Explorer with a lot more data sets available. Andorra now has a GDP growth rate.
Rickety signature.

Filed Under: Blogging, Population Tagged With: Data Set, Google

World Total Fertility Rate Declines

October 20, 2009 by rickety 18 Comments

Aurora in egg

Total Fertility Rate

In the last few decades there have been significant decreases in world fertility rates. The replacement fertility rate is roughly 2.1 births per woman for most industrialized countries but higher for many less developed nations. The Total Fertility Rate (TFR) of a population is the average number of children that would be born to a woman over her lifetime.

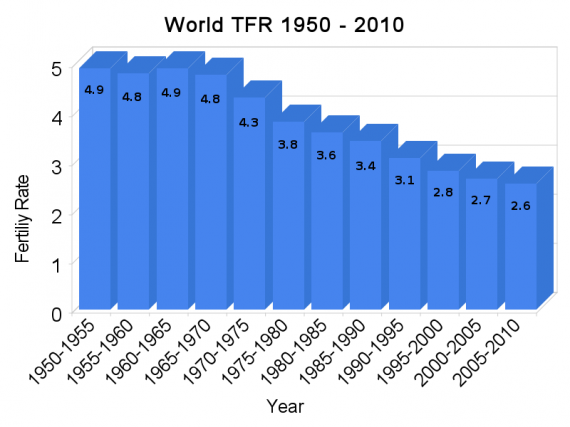
The chart below shows the World TFR in columns of 5 years, starting in 1950. The TFR for 2009 and 2010 are estimated. Take a look at the TFR chart below and the other statistics and join me in a discussion of what some of the trends and numbers may mean. For more insight into population trends try playing with the population database provided by the United Nations. Since writing this post the database has been updated and I now link to the latest available information.

World Total Fertility Rate 1950 to 2010

World Total Fertility Rate 1950 to 2010

Crude Birth and Death Rates

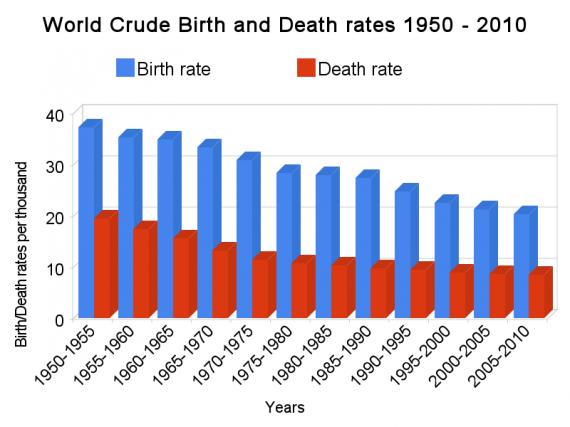
I will show you next a chart with world birth and death rates plotted together. This may prove useful to the discussion later. The Crude Birth Rate is simply the number of births over a given period divided by the person-years lived by the population over that period. It is expressed as number of births per 1,000 population. Likewise the Crude Death Rate is the number of deaths over a given period divided by the person-years lived by the population over that period. It is expressed as number of deaths per 1,000 population.

World crude birth and death rates 1950-2010

World crude birth and death rates 1950-2010

A Russian Demographic Example

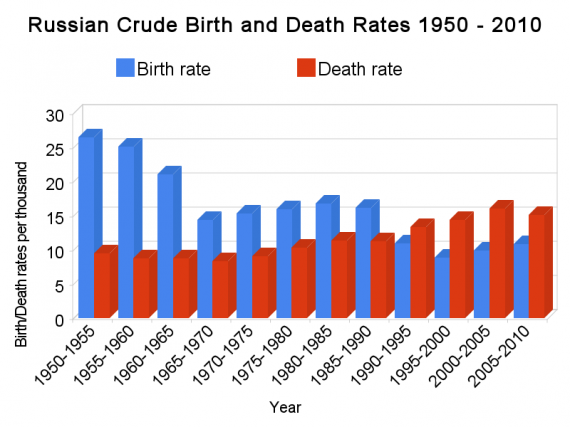
This chart shows the Russian Federation’s demographic crisis quite plainly. All European countries have a TFR less than 2.1 and Russia’s at 1.37 is not the lowest. What is interesting about Russia is it has a sizable population and so their 12.3 million people loss since 1992 (offset by 5.7 million immigrants) is still large, even for a nation of 142 million. Today Russians are diminishing at the rate of over 700,000 a year. One wonders what the effect would be on any nation that suffers sustained population loss.

Russian crude birth and death rates 1950-2010

Russian crude birth and death rates 1950-2010

Decades Long Fertility Decrease

In my chart of world TFR there is plainly a decrease in every 5 year span since the early sixties. The rate of decline seems to be lessening in the last fifteen years but the trend is definitely downwards. The United Nations projects that by 2050 the World TFR will stand at 2.02. This is below replacement level for developed nations and well below a third world country.

Why Population Increases As Fertility Declines

The world birth/death rate chart shows births well above deaths, hence world population is increasing even as TFR is decreasing. Consider that between 1950 and 1955 the death rate was 52% of the birth rate. By 2005 to 2010 the death rate had dropped to 42% of the birth rate. However, even as the death rate drops so too does the birth rate. So why is the world population increasing even as the fertility rate is decreasing? Well, on average, each generation is having fewer children than the previous generation. That is explained by the fertility decrease.

To still have more births than deaths amid a fertility decline is easily accounted for in the decades long delay in the deaths of the parents and grandparents of newly born children. Hence even as the birth rate falls the parents who produced offspring are still alive in most cases and so the death rate is lower. This is called Demographic Momentum. After a number of decades the parents and grandparents die and their children now produce less babies as forecast by the TFR. Population decreases will now begin to appear as in the case of Russia when deaths outnumber births. It is then that the population drops will be in the millions.

Adverse Effects

One adverse effect of a declining population for the young is increased social and economic pressure. They will have to support an infrastructure with costly, intensive care for the oldest among their population. Labor shortages can occur which may cripple labor-intensive sectors of the economy. The decade long economic stagnation of Japan and Germany is linked to demographic problems. Russia has begun a 10-year program to stop the large decline in their population by offering financial incentives and subsidies to encourage women to have children. Australia, France, Italy, Poland, Japan, and Singapore offer thousands of dollars for each baby and regular payments and care for the child.

It is evident that a number of countries see declining birth rates as a serious issue — enough to offer incentives for reproduction. This is not going away anytime soon, especially for nations that have difficulty attracting immigrants. The United States would have a declining population if not for immigration. If the U.S. birth and death rates ever become like Russia’s you will hear more than you ever wanted to know about the total fertility rate.

A Third Way

Phillip Longman of the New America Foundation writes briefly of A Third Way. He states that “a planet that grays indefinitely is clearly asking for trouble.” One alternative to our current aging populations “involves massive state intervention designed to smooth the tensions between work and family life to enable women to have more children without steep financial setbacks.” Longman writes that “so far, countries that have followed this approach have achieved only very modest success.”

Longman then asks: “So is there a third way?”

Yes, though we aren’t quite sure how to get there. The trick will be restoring what, in the days of family-owned farms and small businesses, was once true: that babies are an asset rather than a burden. Imagine a society in which parents get to keep more of the human capital they form by investing in their children. Imagine a society in which the family is no longer just a consumer unit, but a productive enterprise. The society that figures out how to restore the economic foundation of the family will own the future. The alternative is poor and gray indeed. (Phillip Longman, “Think Again: Global Aging,” New America Foundation, October 13, 2010, last paragraph)

A Proclamation to the World

A fascinating document, in support of the family, flowered into existence on 23 September 1995. Entitled The Family: A Proclamation to the World, it was first read in a general Relief Society conference.

The proclamation begins by solemnly proclaiming that marriage between a man and a woman is ordained of God and that the family is central to the Creator’s plan for the eternal destiny of His children. Further, we all are created in God’s image and that gender is an essential part of human identity before, during, and after life on Earth. A summary is outlined of the premortal realm, perpetuation of family relationships beyond the grave, and of temple ordinances and covenants. Now here is the part that most pertains to our discussion:

The first commandment that God gave to Adam and Eve pertained to their potential for parenthood as husband and wife. We declare that God’s commandment for His children to multiply and replenish the earth remains in force. We further declare that God has commanded that the sacred powers of procreation are to be employed only between man and woman, lawfully wedded as husband and wife.

The proclamation continues by identifying parental responsibilities in the rearing of children. To teach them to love and serve one another, to observe the commandments of God, and to obey the law. A formula for happiness and for a successful marriage is detailed. And would a proclamation be complete without a warning?

We warn that individuals who violate covenants of chastity, who abuse spouse or offspring, or who fail to fulfill family responsibilities will one day stand accountable before God. Further, we warn that the disintegration of the family will bring upon individuals, communities, and nations the calamities foretold by ancient and modern prophets.

We call upon responsible citizens and officers of government everywhere to promote those measures designed to maintain and strengthen the family as the fundamental unit of society.

Summary

For decades our minds were filled with government propaganda of a world starving to death and grossly overpopulated with the West running out of food. Even today we hear similar cries. I find it ironic that many of these same governments are now offering thousands of dollars to their populace if they would just have a baby — or maybe two, or three. My wife and children — and now grandchildren are a constant source of joy to me. I am grateful that I followed the wise counsel of religious leaders (and ignored the politicians and “experts”) many years ago.

I am a software engineer by trade and know very little about world fertility rates. But the best way to learn is to write about it and discuss it. I look forward to your comments whether or not you agree with me.

Sources

  • Population Division of the Department of Economic and Social Affairs of the United Nations Secretariat, World Population Prospects: The 2008 Revision, Population Database, October 19, 2009. The updated link points to the latest data not available when this post was published.
  • Find your country in the UN TFR Ranking or the CIA TFR Ranking.
  • World Population Growth Rates: 1950-2050 — From the U.S. Census International Database.

External Articles

This list is updated occasionally, with newer additions listed first.

  • About That Overpopulation Problem — Facing a declining world population.
  • Daring few challenge China’s 1-child limit — “I don’t think having a baby is any kind of crime.”
  • A tale of three islands — World population reaches 7 billion. Don’t panic.
  • World population — Boom to bust? — World EFR is 2.4, barely above the 2.3 replacement rate.
  • Selective abortions creating imbalanced world population — Unnatural selection.
  • Aging Population and Gender Imbalance Challenge China’s One-Child Policy — But no change.
  • The End of Japan as an Industrial Power? — Japan’s workers will drop by 20% in 20 years.
  • Global Aging And The Crisis Of The 2020’s — Population trends mean a more dominant US role.
  • India’s Secret Weapon in its Economic Race With China: Demographics — When? Around 2030.
  • Think Again: Global Aging — How did the world get so old, so fast?
  • Rumkin.com Population Counter — Watch the Russian population decreasing.
  • Population decline — Economic consequences. Wikipedia.
  • Population Growth Rates — Pick your own countries to compare with Google Public Data Explorer
  • Realities of the Population Explosion — Written almost 40 years ago.
  • Why Japan Isn’t Rising — Japan’s population projected to fall 38 million by 2055.
  • Japan’s children population at new record low — 29th straight year of fewer children.
  • China’s Population to Peak in 2026 — Peak is earlier and lower than previously projected.
  • Perfect population storm on horizon — New Zealand’s falling birthrate and emigrating workers.
  • Taiwan’s sinking birth rate threatens productivity — Taiwan scrambling to raise birth rate.
  • Have more babies — Singapore Prime Minister calls on couples to have more children.
  • The Birth Dearth — Loss of markets due to a declining population.
  • The Population Surprise — Population greatly affected by human values.
  • Don’t blame the babies — It is the bureaucrats, not babies, who are to blame.
  • The ‘population bomb’ has fizzled — Underpopulation causes greater alarm than overpopulation.
  • Population: Arguments for and against growth abound — Predictions of starvation have been wrong.

Photo Credit: Adelaide
Rickety signature.

Filed Under: Population, Rickety Picks Tagged With: Birthrate, TFR, World

Life Expectancy and Health Care Plans

July 28, 2009 by rickety 3 Comments


House Democrats' Health Plan.

Organizational Chart of the House Democrats’ Health Plan. Click to enlarge. Courtesy Rep. John Boehner

Health Care Debate

There has been considerable debate over health care of late and all manner of statistics presented to bolster certain points of view. I have read through some of this material but in the end I still hold the same ideas as I have held for years. I like the health care I have and I believe many millions feel the same way about their health care. Hence my view is that the answer to our current system is not a massive disruption but a gradual change to build on what works and implement improvements that are tried and tested over time.

I’ve been thinking about some wild statements that have been made that claim that the “U.S. health care system is broken” and that we should have “health care delivered the same way as countries like the United Kingdom and Canada.” I lived in England for 28 years so I am aware of and experienced health care there. I’ve lived in the U.S. for over 28 years and have had occasion to partake of health care in this fine nation. As I degenerate into greater decrepitude no doubt I will need even more health care in the future.

Life Expectancy

Now, if the U.S. health care system is so sick and socialized medicine so superior, one would think a large discrepancy would show up in life expectancy tables. Examining the CIA World Factbook 2008 estimates we find that in the United Kingdom life expectancy at birth is 78.7 years. For the U.S. the number is 78.06 years. Less than eight months difference. The U.S. stacks up very well considering that per capita violence, obesity, drunk driving, and illegal drug use is probably much higher than among Brits. Of course the United Kingdom does have soccer hooliganism that probably keeps their life expectancy down whereas the U.S. has millions of its population uninsured. I can only conclude that that these legions of uninsured are getting health care somewhere and that English soccer fans don’t hurt the national life expectancy as much as first thought.

Of course Canada weighs in with a healthy life expectancy of 80.34 years. Maybe we should copy their health care model. While we are immersed in our expectancy tables let us not stop at Canada but cast our eyes higher. Macau has the greatest life expectancy with 84.379 years. Notice the extra decimal place of accuracy in the years — Macau likes to get every last hour of life out of their citizens. Where is Macau? According to Wikipedia, Macau is a special administrative region of the People’s Republic of China. Macau lies on the western side of the Pearl River Delta, bordering Guangdong province in the north and facing the South China Sea in the east and south.

Macau

So perhaps we should adopt the Macau Healthcare Model or MHM and we will all live longer. Macau is served by one major public hospital, one major private hospital, a university hospital, and numerous health centers providing free basic medical care. Consultation in traditional Chinese medicine is also available (this must be what gives them the extra edge in life expectancy). The Health Bureau is responsible for coordinating the activities between the public and private organizations in the area of public health. The Macau Centre for Disease Control and Prevention monitors the operation of hospitals, health centers, and the blood transfusion center. It also handles the organization of care and prevention of diseases affecting the population, sets guidelines for hospitals and private health care providers, and issues licenses.

Should we adopt the MHM? On reflection I will stay with my 76 years of life expectancy and forgo those extra eight years. I am just too old and I am sick of politicians saying I have to change my health care that is working very well thank you. And for all those hankering for a MHM or the equivalent, why not scoot on over to the United Kingdom and grab yourself an extra eight months of life expectancy. Steer clear of the soccer hooligans and be sure to send me a postcard.

Related Articles

Mr. President, what’s the rush? — Mitt Romney writing in USA Today.
List of countries by life expectancy
Low Life Expectancy in the United States: Is the Health Care System at Fault? — Population Studies Center, University of Pennsylvania

Rickety signature

Filed Under: Population Tagged With: Care, Life Expectancy

United States Total Fertility Rate Increases

January 19, 2009 by rickety 27 Comments

Bryson and Grandpa

Bryson and Grandpa

Born in the U.S.A.

Recently I wrote about The Falling Fertility of Europe. Now it is the turn of the United States. The U.S. has one of the highest fertility rates in the West. The most recently available fertility statistics from the government are for 2006. Take a look at the table below and then join me in a discussion of what some of the numbers may mean. In the table below Birth rate refers to live births per 1,000 population. Teen birth rate is live births to women aged 15-19 per 1,000 of women aged 15-19 in the population. Fertility rate is live births per 1,000 women aged 15-44 years. The TFR (Total Fertility Rate) of a population is the average number of children that would be born to a woman over her lifetime. Bear in mind that the replacement fertility rate is roughly 2.1 births per woman for most industrialized countries.

Highs and Lows

By sorting the TFR column we can see that 25 states have a Total Fertility Rate of 2.1 or higher. This is the replacement rate of the population. Of course because of immigration the population is increasing. Through the sort we can also see that Vermont has the lowest TFR and Utah the highest. Why is this? In Utah the high birth rate is undoubtedly due to the high percentage of Mormons in the state, who tend to have larger families. Vermont’s low birth rate, according to the Times Argus, is attributed to its racial homogeneity and high education levels among women — factors not easily changed by government intervention. Hispanic women, who comprise less than one percent of the state’s population, statistically have higher birth rates.

The Problem of Low Birth Rates

Consider what the Vermont Governor Douglas has to say:

Employers cite adequacy of the workforce as one major concern for future success here. We have employers who have created good jobs and want to create more, but they need a qualified workforce to take those jobs.

In the last year the number of people in Vermont’s workforce fell by 2,000. The low birth rate is a component of a much bigger problem. The median age of Vermont’s workforce, at 42.3 years old, is the highest in the nation. In the next twenty years the workforce is expected to shrink annually as those wage-earners reach retirement age. Because surrounding states also have low birth rates the competition for a shrinking pool of workers will become intense.

United States 2006 Fertility Rates by State

Click ONCE on column headers to sort.

State Birth rate Teen birth rate Fertility rate TFR
United States 14.1 41.4 68.4 2.10
Alabama 13.7 53.5 67.0 2.03
Alaska 16.4 44.3 76.7 2.32
Arizona 16.6 62.0 81.6 2.44
Arkansas 14.6 62.3 72.2 2.18
California 15.4 39.9 71.8 2.18
Colorado 14.9 43.8 70.2 2.11
Connecticut 11.9 23.5 58.8 1.90
Delaware 14.0 41.9 67.3 2.09
District of Columbia 14.7 48.4 58.4 1.70
Florida 13.1 45.2 67.3 2.09
Georgia 15.9 54.2 72.4 2.23
Hawaii 14.8 40.5 73.9 2.23
Idaho 16.5 39.2 80.9 2.42
Illinois 14.1 39.5 66.8 2.03
Indiana 14.0 43.5 68.3 2.08
Iowa 13.6 32.9 69.1 2.14
Kansas 14.8 42.0 73.3 2.23
Kentucky 13.8 54.6 67.1 2.05
Louisiana 14.8 53.9 70.6 2.11
Maine 10.7 25.8 54.5 1.77
Maryland 13.8 33.6 64.2 2.01
Massachusetts 12.1 21.3 56.9 1.78
Michigan 12.6 33.8 61.7 1.93
Minnesota 14.2 27.9 68.7 2.14
Mississippi 15.8 68.4 75.7 2.26
Missouri 13.9 45.7 67.9 2.06
Montana 13.2 39.6 69.5 2.13
Nebraska 15.1 33.4 75.1 2.29
Nevada 16.0 55.8 77.9 2.36
New Hampshire 10.9 18.7 53.4 1.75
New Jersey 13.2 24.9 64.5 2.05
New Mexico 15.3 64.1 74.7 2.23
New York 13.0 25.7 61.1 1.89
North Carolina 14.4 49.7 69.0 2.13
North Dakota 13.6 26.5 68.7 2.14
Ohio 13.1 40.0 64.7 1.99
Oklahoma 15.1 59.6 74.7 2.20
Oregon 13.2 35.7 65.4 1.96
Pennsylvania 12.0 31.0 60.6 1.93
Rhode Island 11.6 27.8 54.6 1.72
South Carolina 14.4 53.0 69.6 2.14
South Dakota 15.2 40.2 78.5 2.40
Tennessee 14.0 54.7 67.5 2.07
Texas 17.0 63.1 78.8 2.36
Utah 21.0 34.0 94.1 2.63
Vermont 10.4 20.8 52.2 1.69
Virginia 14.1 35.2 66.3 2.05
Washington 13.6 33.4 65.2 1.98
West Virginia 11.5 44.9 59.4 1.82
Wisconsin 13.0 30.9 64.0 2.01
Wyoming 14.9 47.3 75.9 2.24

.

Higher Teen Birth Rates

2006 saw significant increases of teen birth rates in 26 states. My table doesn’t show previous year’s statistics but an article in USA Today has a useful map comparing 2005 with 2006. Some blame the increase on a more sexualized culture and greater acceptance of births to unmarried women. Others say abstinence-only sex education and a possible de-emphasis on birth control may play a part. According to USA Today, Sarah Brown, CEO of the National Campaign to Prevent Teen and Unplanned Pregnancy, says she is less inclined to believe abortion is driving higher teen birth rates and suggests that increases in high-profile unmarried births in Hollywood, movies and even politics is a significant factor for impressionable teens. Sarah says:

In the last couple of years, we had Jamie Lynn Spears. We had Juno and we had Bristol Palin. Those three were in 2007 and 2008 and not in 2005 to 2006, but they point to that phenomenon.

Total Fertility Rate Details

The TFR was 2.1 births per woman in 2006, a two percent increase compared with 2005 (2.05) and the highest reported since 1971 (2.27). This is the first year the U.S. TFR has been above replacement since 1971. From 1990 to 1997, the TFR decreased substantially (from 2.08 to 1.97), but has generally increased since 1998. The increase in the TFR in 2006 reflects the increase in birth rates for nearly all age groups, especially for those women aged 15–19 and 20–24 years. The TFR also increased for nearly all race and Hispanic origin groups between 2005 and 2006 with the rate increasing 1 percent for non-Hispanic white, 3 percent for Hispanic, and 5 percent for non-Hispanic black women. (Source: National Center for Health Statistics PDF)

Summary

If not for immigration, the U.S. population would merely be replacing itself. In future years the birth rates will likely be declining, along with world birth rates in general. Because many have been indoctrinated with the “population explosion” myth it will be difficult to convince sufficient numbers that there is even a problem with low birth rates. What is required is an emphasis on family and the preciousness of children. Governments need to be friendly towards traditional marriage and encourage all to support family life.

External Articles

This list is updated occasionally, with newer additions listed first.
Census: Number of U.S. youth shrinks — Decline of more than 260,000 from 2010.
U.S. population grows at slowest rate since 1940s — A growth rate of 0.92 percent.
A Connecticut Town Adjusts to a Graying Population — Connecticut’s median age was 40 in 2010.
Is economy best birth control? US births dip again — Total Fertility Rate fell to 1.9 children.
Will the housing bust produce a baby bust? — A likely contributor to a baby bust.
Older Populations Soar as Age Trend Accelerates — Eastern and “rust belt” areas are aging rapidly.
Census reveals plummeting U.S. birthrates — There are now more households with dogs than children.
Where have all the children gone? — Number of kids declining across the country.
Census: New Hampshire population aging, growing — Median age jumps from 37 to 41.
The Baby Bust of 2009 in the United States — Births fell from 4,316,233 (2007) to 4,131,019 (2009).
Driven by the Recession, a Baby Bust Hits the U.S. — Threatens already-strained social programs.
Report: U.S. births hit all-time high — More babies in 2007 in the U.S. than ever before.
Babies — Expensive, Intrusive and Too Few for the Economy — $286,000 per baby.
3 Utah metro areas among fastest growing in U.S. — Utah’s continuing baby boom credited.
Birthrate drops in multiple states — Pregnancy falloff began months before economy’s troubles.
Population drop-off vexes Maine residents — Stems mostly from young people leaving.
The Family: The Hope for the Future of Nations — Happiness and the future is linked to children.
U.S. Birth Rate Decline Linked to Recession — An analysis of state fertility.
400 Million People Can’t Be Wrong — Why America’s new baby boom bodes well for our future.
Rickety signature.

Filed Under: Population Tagged With: Birthrate, TFR

The Falling Fertility of Europe

January 16, 2009 by rickety 55 Comments

Europe's birthrate is falling

Europe's birthrate is falling

Total Fertility Rate

In Europe there are significant decreases in birthrates. The replacement fertility rate is roughly 2.1 births per woman for most industrialized countries. The Total Fertility Rate (TFR) of a population is the average number of children that would be born to a woman over her lifetime. All of the European countries have a TFR less than the replacement rate of 2.1. The average is 1.53 and Lithuania records the lowest TFR at a rickety 1.22 (see the table at the end of this post).

Why?

So why are women in Europe having less babies? A New York Times article No Babies? attempts to answer this question. It concludes that there would seem to be two models for achieving higher fertility: the neosocialist Scandinavian system and the laissez-faire American one. The socialist model helps families with generous government support. The U.S. has a much more flexible work environment which can be helpful to families. In the article, Arnstein Aassve, a sociologist, put it this way:

You might say that in order to promote fertility, your society needs to be generous or flexible. The U.S. isn’t very generous, but it is flexible.

The article briefly mentions that some blame the low birthrate to secularism. That “the West has divorced itself from God and church and embraced a self-interested and ultimately self-destructive lifestyle abetted above all by modern birth control.”

Religion and Fertility

In 2007 the TFR in the United States rose to 2.1, the highest since the 1960s. A factor contributing to this healthy birthrate is the conservative and religiously oriented nature of American society, which encourages larger families. Closer to my home, Utah has a TFR of 2.6, attributed to the 69% Mormon population that traditionally have larger families primarily motivated by religious belief. Even closer to home, my wife and I have five children. Prior to my adult conversion to the Gospel I had planned for no children. As a member of the Church my views on children changed as I learned about the purpose of life and why God has placed us here on Earth.

A Warning

Not only in Europe but world-wide there are declining birthrates. The world TFR has fallen to 2.61 in 2008 from 2.80 in 2000. But Europe is in the most critical situation. Carl Haub of the Population Reference Bureau, in discussing Spain and Italy said:

Maybe tinkering with the retirement age and making other economic adjustments is good. But you can’t go on forever with a total fertility rate of 1.2. If you compare the size of the 0-to-4 and 29-to-34 age groups in Spain and Italy right now, you see the younger is almost half the size of the older. You can’t keep going with a completely upside-down age distribution, with the pyramid standing on its point. You can’t have a country where everybody lives in a nursing home.

And a more direct warning from The Church of Jesus Christ of Latter-day Saints:

We warn that individuals who violate covenants of chastity, who abuse spouse or offspring, or who fail to fulfill family responsibilities will one day stand accountable before God. Further, we warn that the disintegration of the family will bring upon individuals, communities, and nations the calamities foretold by ancient and modern prophets. (The Family: A Proclamation to the World)

Children are so often seen as boat anchors, a drag on society, and consumers of resources. But children are the future. Only by populations increasing into the millions have many advances been possible. Let’s not throw it all away.

European 2008 Total Fertility Rate by Country

Click ONCE on column headers to sort.

Country TFR
Albania 2.02
Andorra 1.32
Armenia 1.35
Austria 1.38
Azerbaijan 2.05
Belarus 1.23
Belgium 1.65
Bosnia and Herzegovina 1.24
Bulgaria 1.40
Croatia 1.41
Cyprus 1.79
Czech Republic 1.23
Denmark 1.74
Estonia 1.42
Finland 1.73
France 1.98
Georgia 1.44
Germany 1.41
Greece 1.36
Hungary 1.34
Iceland 1.91
Ireland 1.85
Italy 1.30
Kazakhstan 1.88
Latvia 1.29
Liechtenstein 1.51
Lithuania 1.22
Luxembourg 1.78
Macedonia 1.58
Malta 1.51
Moldova 1.26
Monaco 1.75
Montenegro 1.83
Netherlands 1.66
Norway 1.78
Poland 1.27
Portugal 1.49
Romania 1.38
Russia 1.40
San Marino 1.35
Serbia 1.69
Slovakia 1.34
Slovenia 1.27
Spain 1.30
Sweden 1.67
Switzerland 1.44
Turkey 1.87
Ukraine 1.25
United Kingdom 1.66
Average 1.53


Sources

CIA World Factbook
European Demographic Data Sheet 2008 (PDF)
Population Growth Rates — Pick your own countries to compare with Google Public Data Explorer

External Articles

This list is updated occasionally, with newer additions listed first.
The vanishing workforce — Germany will lose 20% of its workers.
Lithuanian census reveals population slump — Dropped 10% in a decade.
Germany Faces Economic Downturn with Falling Births — Aging also a factor.
The new baby boom — Average number of children a woman has is 2.8
Spain’s cash-for-kids plan fails to boost birth rate
Hungary Population Drops to Less Than 10 Million for First Time Since 1960
Rumkin.com Population Counter — Watch the German population decreasing.
Latvia: The Demographic Price Of Procrastination
Population Consequentialism
In need of a miracle
Eastern Germany Confronts Skilled Labor Shortage

Rickety signature

Filed Under: Population Tagged With: Birthrate, Europe, TFR

Recent Comments

  • Anonymous on One Hundred Thousand Milpengo
  • Jeremy McMullin on Mesa Easter Pageant – Jesus The Christ
  • Genma Vincent on George W Bush on Religion
  • Anonymous on The Twelve Stones of The Apocalypse
  • Judy Crowe on Ten Artists Paint Old Testament Women
  • Angela on The Twelve Stones of The Apocalypse
  • Angela on The Twelve Stones of The Apocalypse
  • AllHailKingJesus on The Twelve Stones of The Apocalypse
  • Microwave guy on Make a Halloween Costume from a Microwave Oven
  • Anonymous on Arduino AVR High-Voltage Serial Programmer

Who is this Rickety?

Rick at homeI'm Rick Willoughby. I live in Utah, a retired Software Engineer. I'm a Mormon, married with 5 children and 12 grandchildren.

I emigrated from England in my late twenties, bringing with me one small suitcase and a few dollars. I appreciate the opportunities America has given me and the friendliness of the people to new citizens.

I blog about my family as well as politics, religion, finance, technology, and other topics.

Copyright © 2025 · Lifestyle Pro Theme on Genesis Framework · WordPress · Log in